Logistics Business Market Share Graph - Industry Insights and Data Visualization
RM0100012_11
- Last Update 01/28/2025
- File Size 1.5MB
- # of Slides 2
- File Format PPTX
- Slide Ratio 16:9
- Color
Keywords
- #Content-Based Slides
- #Design-Based Slides
- #Product/Service Introduction
- #Market and Competitor Analysis
- #Diagram
- #Graph
- #Development Status
- #Market Share
- #Table
- #Circles
- #Pie Chart
- #16:9
- #pie chart PowerPoint slide
- #3-segment pie graph template
- #market share visualization
- #logistics business data
- #pie chart slide download
About the Product
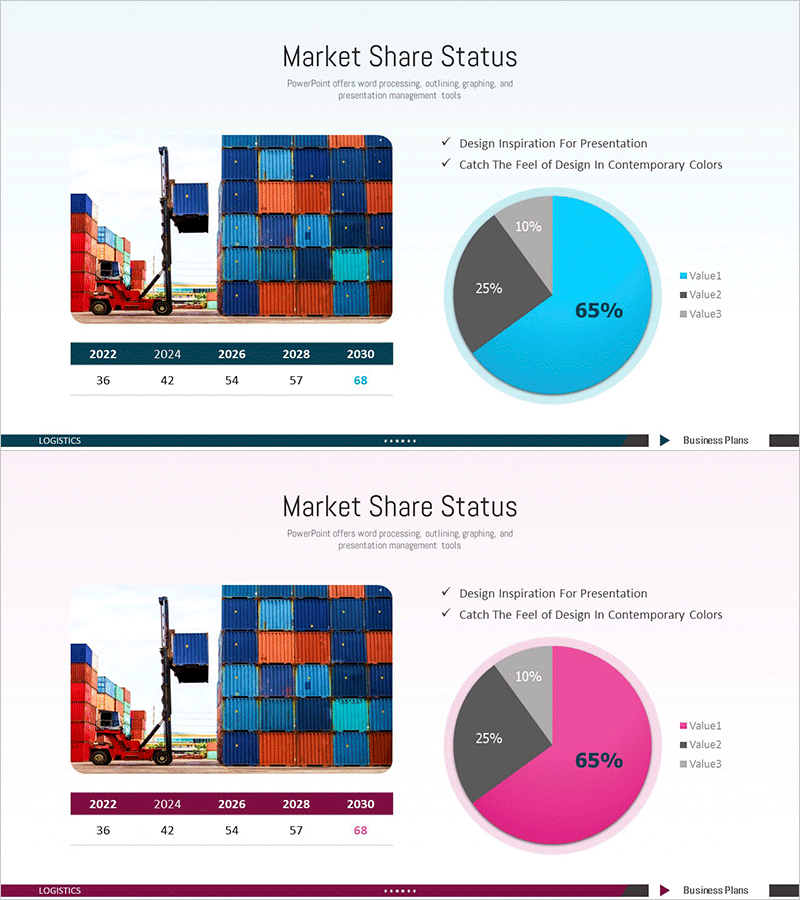
A professional pie chart slide designed for logistics and business analysis presentations. This PowerPoint template displays market share data with three segments: 65% primary value in cyan, 25% secondary value in gray, and 10% tertiary value in orange. The slide combines a container logistics image with year-over-year growth metrics (2022–2030: 36 to 68) to illustrate industry trends and market positioning. Fully editable in PowerPoint, this slide is ideal for business reports, investor pitch decks, marketing plans, and strategic presentations requiring clear data visualization and professional design.
Usage Points
-
Main Usage
Visualizes market share, sales distribution, customer composition, or competitive positioning across 3–4 categories using a pie chart format. The 65% dominant segment is visually emphasized, while supporting segments (25%, 10%) provide context. Year-over-year numerical data (2022–2030 growth trend) complements the pie chart to show both current state and trajectory.
-
How to Use
Apply this slide in market analysis sections of business reports, competitive landscape slides in investor presentations, customer segmentation charts in marketing plans, and strategic positioning analyses in executive briefings. Directly edit the legend labels, percentages, and numerical data to match your specific dataset.
-
Recommended For
Logistics and transportation professionals, business analysts, marketing managers, executive report writers, management consultants, and strategic planning teams presenting market conditions, competitive analysis, customer demographics, or operational performance metrics.
-
Slide Structure
Left side features a container logistics image paired with a year-over-year data table (2022: 36 → 2030: 68). Right side displays a 3-segment pie chart with cyan (Value1, 65%), gray (Value2, 25%), and orange (Value3, 10%) segments. Legend and checkmark callouts identify each segment. Two color theme variants (cyan and magenta) are included.
Related Products
-

Market Share Analysis Graph & Table – Enhancing Understanding through Data Visualization
#Product/Service Introduction #Market and Competitor Analysis #Diagram
-

Internet Shopping Market Analysis Chart
#Product/Service Introduction #Market and Competitor Analysis #Diagram
-

Pie Chart Analysis and Table – Visualizing Market Share
#Market and Competitor Analysis #Diagram #Graph
-

Brand Awareness Distribution Chart – Market Share Analysis
#Product/Service Introduction #Market and Competitor Analysis #Graph
