Internet Shopping Market Analysis Chart
RJ0400046_16
- Last Update 05/29/2025
- File Size 0.8MB
- # of Slides 2
- File Format PPTX
- Slide Ratio 16:9
- Color
Keywords
- #Content-Based Slides
- #Design-Based Slides
- #Product/Service Introduction
- #Market and Competitor Analysis
- #Diagram
- #Graph
- #Development Status
- #Market Share
- #Table
- #Circles
- #Standard Table
- #Pie Chart
- #16:9
- #pie chart PowerPoint slide
- #pie graph template
- #market analysis chart
- #data visualization slide
- #how to create pie chart in PowerPoint
- #percentage breakdown slide template
About the Product
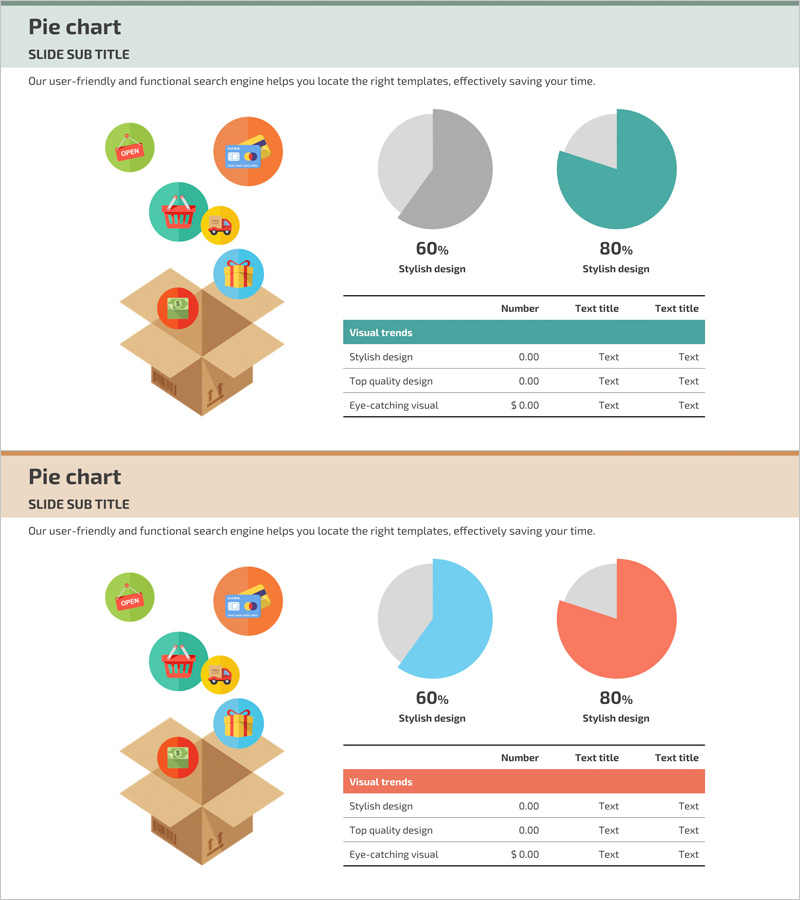
A two-slide PowerPoint presentation template featuring pie charts for internet shopping market analysis. Each slide displays two pie charts with 60% and 80% segment ratios in color combinations of gray, teal, blue, and coral. The left side includes a 3D box illustration with five category icons, while the right side presents a data table for quantitative information. Designed in 16:9 widescreen format for modern presentation environments, this PPTX template is fully editable and ready for immediate use in business reports and market analysis presentations.
Usage Points
-
Main Usage
Effectively visualizes market share, composition ratios, and percentage breakdowns using pie chart graphics. Ideal for business reports, marketing presentations, and e-commerce analysis where data-driven insights on consumer behavior and market segments need clear visual representation.
-
How to Use
Replace the category icons on the left 3D box illustration with your own icons or images. Update the pie chart percentages and labels with actual data values. Complete the presentation by filling the data table below with detailed metrics and corresponding figures that support your analysis.
-
Recommended For
Marketing professionals, market analysts, business executives, and e-commerce strategy teams presenting market trends, sales channel composition, consumer segment distribution, and competitive market positioning.
-
Slide Structure
Two identical layout slides with title and subtitle area at top-left, 3D box graphic with five category icons at center-left, two pie charts (60% and 80% segments) at right, and three-row by three-column data table at bottom. Color schemes vary by slide: gray-teal, blue-coral combinations.
Related Products
-

Chart Analysis of Aerobic Exercise – Market Share Visualization
#Market and Competitor Analysis #Diagram #Graph
-

Development Status Analysis Pie Type 3D Graph
#Product/Service Introduction #Market and Competitor Analysis #Graph
-

Development Status Pie Chart – Visualizing Product Progress
#Product/Service Introduction #Market and Competitor Analysis #Graph
-

Square Frame Presentation Template – Pie Chart & Table
#Market and Competitor Analysis #Financial Plans and Performance #Diagram
