Business Market Status Analysis Chart – Competitive Statistics
RM0100011_4
- Last Update 01/28/2025
- File Size 1MB
- # of Slides 2
- File Format PPTX
- Slide Ratio 16:9
- Color
Keywords
- #Content-Based Slides
- #Design-Based Slides
- #Product/Service Introduction
- #Market and Competitor Analysis
- #Graph
- #Other
- #Development Status
- #Market Status
- #Horizontal Bar
- #Grouped Horizontal Bar
- #16:9
- #grouped bar chart PowerPoint
- #comparison analysis slide template
- #market trend visualization
- #year-over-year data chart
- #business statistics presentation
- #how to create grouped bar chart in PowerPoint
About the Product
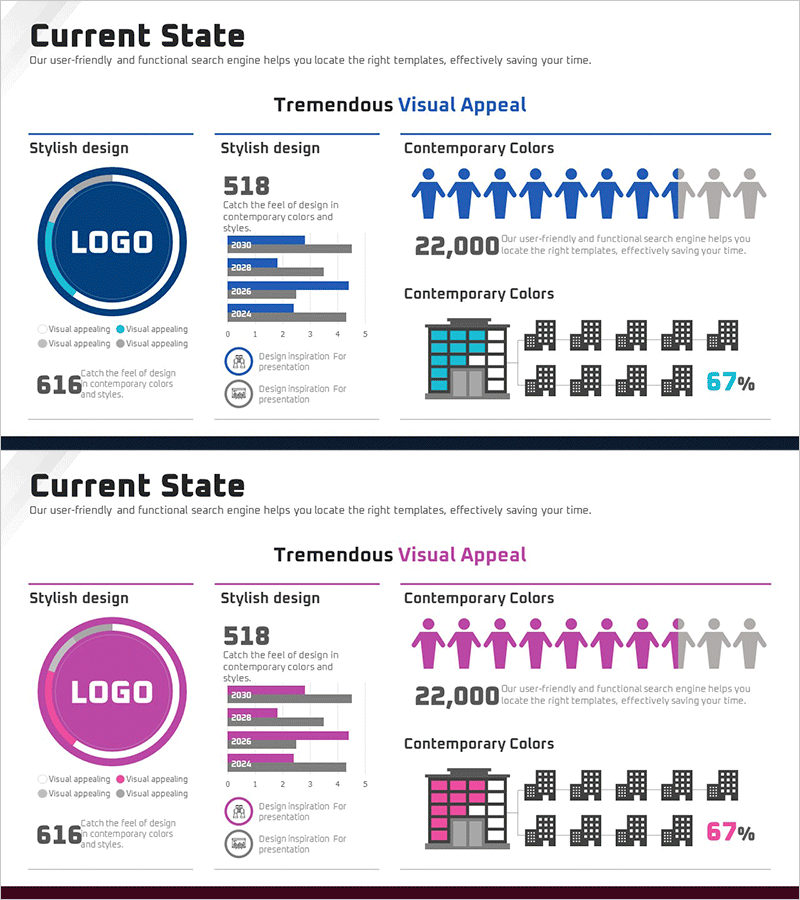
A 2-slide PowerPoint template featuring grouped bar charts designed for business market analysis and competitive statistics. This presentation slide set enables side-by-side comparison of data across four years (2030, 2029, 2027, 2024), making it ideal for trend analysis and performance benchmarking. The dark blue background with color-coded bars provides clear visual distinction between data series, allowing viewers to instantly grasp year-over-year variations. Perfect for market reports, sales performance analysis, customer satisfaction metrics, and strategic planning presentations. The slides are fully editable and ready for immediate use in business decks.
Usage Points
-
Main Usage
Enables multi-dimensional data comparison across time periods and categories in business presentations. Effectively visualizes market size trends, competitor performance benchmarks, departmental results, and customer satisfaction changes to support data-driven decision-making and strategic discussions.
-
How to Use
Input your actual data into the designated cells and the bar chart automatically updates. Color-coded bars distinguish between years and categories, while the legend clarifies data meaning. Present the data chronologically to help audiences understand trends and patterns more effectively.
-
Recommended For
Executive reports, quarterly performance reviews, market analysis presentations, investor relations meetings, and marketing strategy sessions. Valuable for finance teams, marketing departments, sales divisions, and business planning units requiring data visualization for stakeholder communication.
-
Slide Structure
Two-slide set with grouped bar charts comparing four years of data (2030, 2029, 2027, 2024) side by side. Dark blue background with color-differentiated bars for each year, including legend and numerical labels for easy data interpretation and professional presentation.
Related Products
-

Customer Rating Percentage Infographic Chart for Programs
#Product/Service Introduction #Market and Competitor Analysis #Graph
-

Graph of Sales by Region – Visualizing Market Status
#Market and Competitor Analysis #Graph #Other
-

Domestic Market Status Analysis – Regional Data Visualization
#Company Introduction #Market and Competitor Analysis #Other
-

Doughnut Chart for Mobile Network Development and Market Status Visualization
#Product/Service Introduction #Market and Competitor Analysis #Graph
