Running Silhouette Chart - Market and Competitor Analysis
RJ0800031_9
- Last Update 08/08/2025
- File Size 0.8MB
- # of Slides 2
- File Format PPTX
- Slide Ratio 16:9
- Color
Keywords
- #Content-Based Slides
- #Design-Based Slides
- #Market and Competitor Analysis
- #Diagram
- #Other
- #Market Status
- #Competitive Advantage
- #Cluster
- #Inclusive Cluster Diagram
- #Silhouette
- #16:9
- #silhouette chart PowerPoint
- #competitive analysis slide
- #market positioning diagram
- #running figures PPT
- #competitor comparison presentation
About the Product
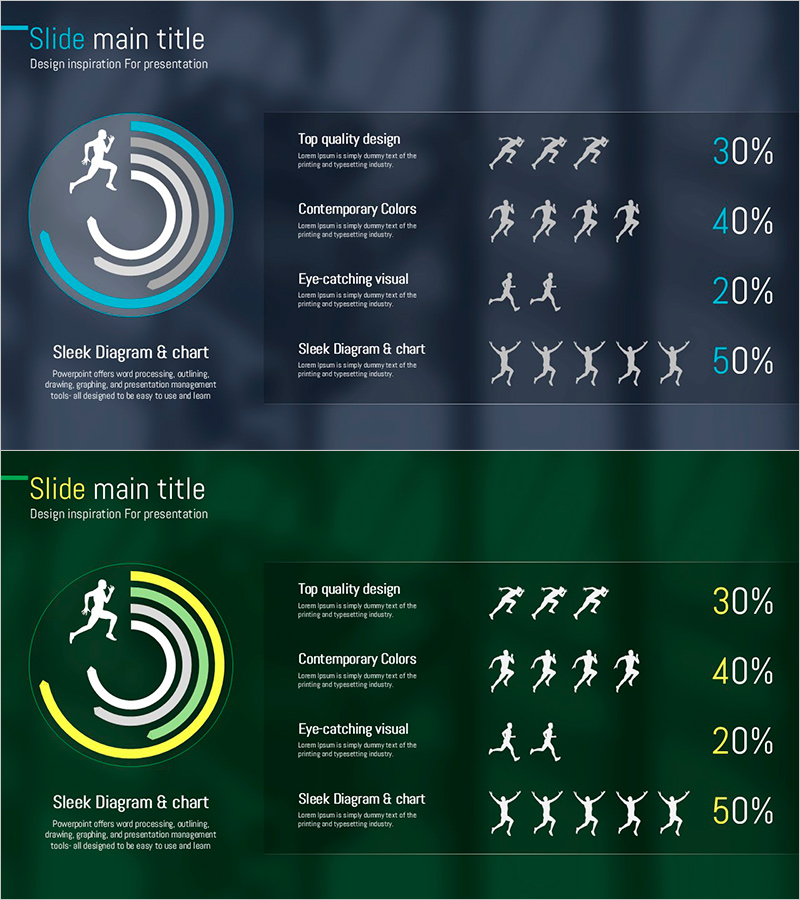
A PowerPoint slide featuring a running silhouette chart designed for market positioning and competitive analysis presentations. Five running figures are arranged on a circular diagram to visually represent competitive advantage and market positioning. The design uses a minimalist teal and gray background with white silhouettes and percentage values highlighted for data-driven presentations. Formatted in 16:9 widescreen with 2 slides, all text and icons are fully editable. Ideal for executive reports, strategic presentations, and marketing decks where competitive analysis sections need visual impact.
Usage Points
-
Main Usage
Communicates competitive positioning and market analysis through human silhouette visualization, enabling direct comparison of five competitive factors or competitors simultaneously. Percentage metrics support strategic decision-making during business planning and market assessment phases.
-
How to Use
Insert into executive summary sections of business reports, market analysis pages of business plans, and positioning slides in marketing strategy presentations. Customize silhouette count and percentage values with actual data for immediate presentation use without redesign.
-
Recommended For
Executives, strategy planners, marketing managers, and business development teams presenting competitive analysis to stakeholders and investors. Particularly effective when comparing five competitors or five competitive dimensions in a single visual.
-
Slide Structure
Two-slide set with circular diagram layout. Each slide positions five running silhouettes on a central circular diagram, with four text description items and percentage values (30%, 40%, 20%, 50%) arranged on the right side. Includes two color variants: teal and yellow background versions.
Related Products
-

Carrying Rank Chart by Item – Efficient Market Analysis
#Market and Competitor Analysis #Diagram #Market Status
-

Natural Recreation Area Preference Chart – Market Status Analysis
#Market and Competitor Analysis #Diagram #Graph
-

Recreation Activity Graph – Market and Competitive Advantage Analysis
#Market and Competitor Analysis #Graph #Other
-

Achievement Goals and Status Chart – Visualizing Competitive Advantage
#Market and Competitor Analysis #Graph #Market Status
