Yearly Sales and Profit Statement – Financial Visualization
RM0100011_32
- Last Update 01/28/2025
- File Size 1MB
- # of Slides 2
- File Format PPTX
- Slide Ratio 16:9
- Color
Keywords
- #Content-Based Slides
- #Design-Based Slides
- #Market and Competitor Analysis
- #Financial Plans and Performance
- #Diagram
- #Sales and Revenue
- #Key Financial Indicators
- #Table
- #16:9
- #income statement PowerPoint slide
- #financial data comparison table
- #yearly sales projection slide
- #how to create financial reports in PowerPoint
- #revenue analysis presentation
About the Product
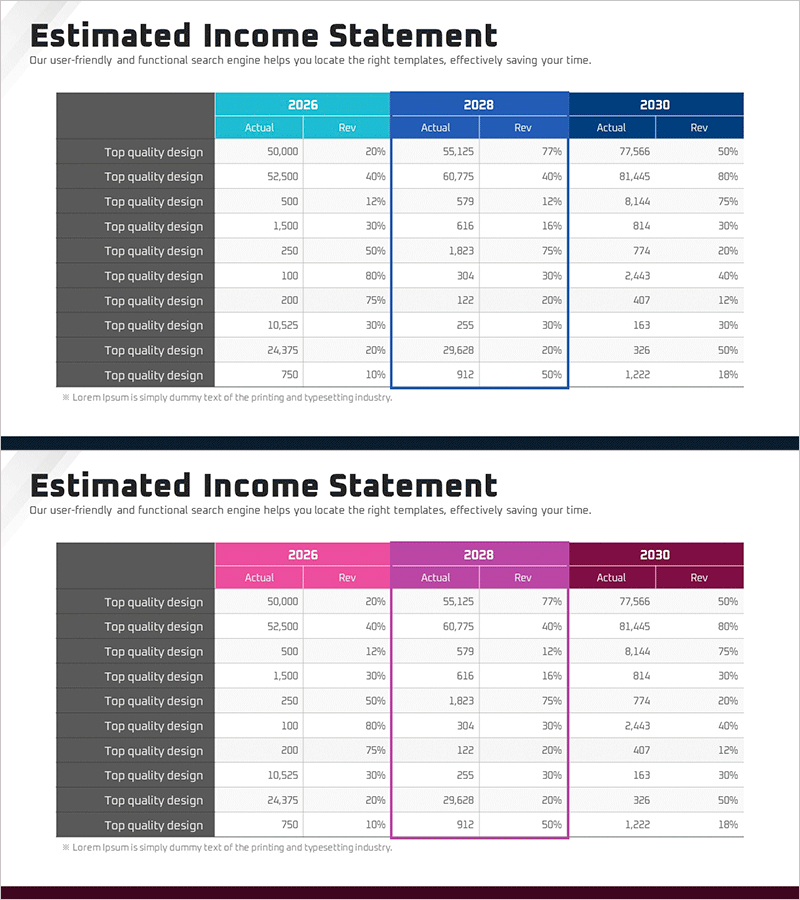
A financial data slide comparing annual sales and profit across three fiscal years from 2026 to 2030. This PowerPoint slide displays actual results and revenue projections side-by-side, making it ideal for investor presentations and financial reports. The slide features a blue and purple header with white background to maximize readability of numerical data, presenting both actual amounts and growth rates for each line item. Use this presentation slide in the financial section to clearly communicate financial performance to executives, investors, and stakeholders.
Usage Points
-
Main Usage
Compare actual performance and projections across three fiscal years to visualize financial growth trends at a glance. Present critical financial metrics with both absolute figures and growth percentages to support executive and investor decision-making.
-
How to Use
Use as a core financial section slide in IR materials, financial reports, and management presentations. Edit row labels and numerical values with your own data and insert directly into presentation decks. Customize color scheme to match corporate branding guidelines.
-
Recommended For
CFOs, financial managers, executives, and investor relations professionals presenting financial performance. Particularly effective for earnings announcements, investor pitches, shareholder meetings, and bank loan applications requiring credible financial documentation.
-
Slide Structure
Two-slide layout displaying three fiscal years (2026, 2028, 2030) with Actual and Rev (projected) columns for each year. Left gray section contains 10 line items, right section shows multi-year numerical comparisons in a structured table format enabling side-by-side analysis.
Related Products
-

Sales Outlook Table & Bar Chart – Market and Financial Insights
#Market and Competitor Analysis #Financial Plans and Performance #Diagram
-

Trend of Cargo Volume by Transportation Means – Market Trends Analysis
#Market and Competitor Analysis #Financial Plans and Performance #Diagram
-

Business Forest Wide Template Europe Map – A New Horizon for Market Analysis
#Market and Competitor Analysis #Financial Plans and Performance #Diagram
-

Sales and Profit Table – Statistical Financial Performance
#Financial Plans and Performance #Diagram #Sales and Revenue
