Hologram Wide PPT Table & Segmentation Bar Graph – Trendy Data Visualization
RJ0200053_23
- Last Update 04/13/2025
- File Size 0.6MB
- # of Slides 2
- File Format PPTX
- Slide Ratio 16:9
- Color
Keywords
- #Content-Based Slides
- #Design-Based Slides
- #Market and Competitor Analysis
- #Financial Plans and Performance
- #Diagram
- #Graph
- #Industry Trends
- #Sales and Revenue
- #Table
- #Column
- #Standard Table
- #Segmented Column
- #16:9
- #segmented bar chart PowerPoint
- #bar graph slide template
- #data visualization PPT
- #year-over-year comparison chart
- #multi-series bar graph slide
About the Product
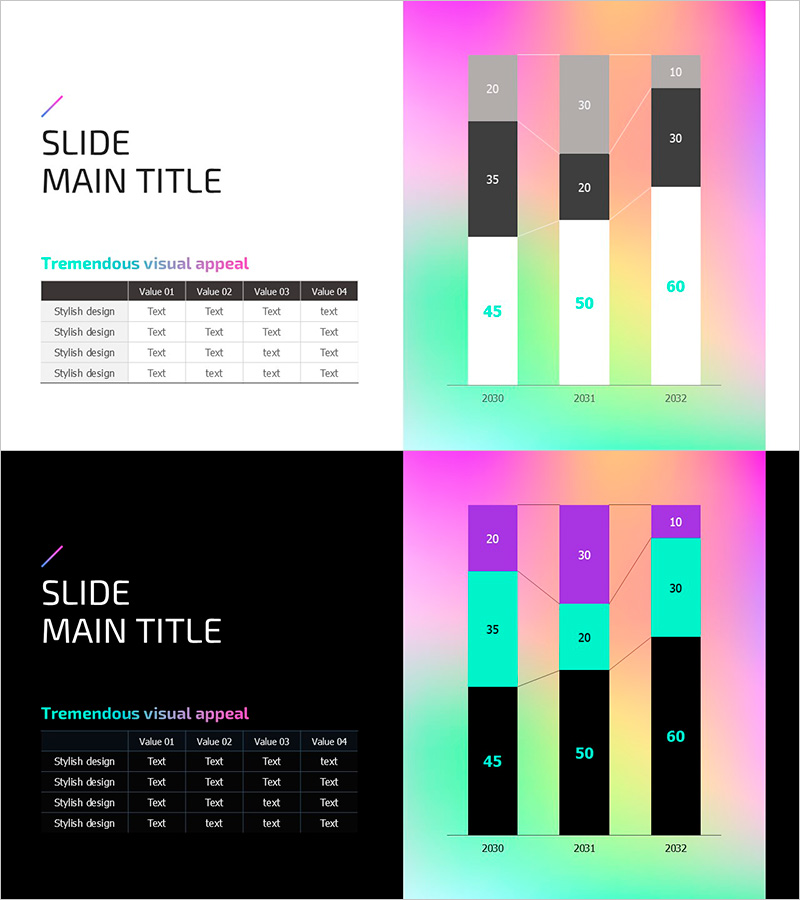
A PowerPoint slide featuring segmented bar charts set against a hologram-style gradient background. The design transitions smoothly through magenta, pink, orange, green, and yellow tones, with data bars rendered in black, gray, and white for clear contrast. Each year (2030, 2031, 2032) displays four comparable data segments, accompanied by a reference table on the left side. This slide effectively visualizes multi-series data changes across three time periods, making it ideal for financial reports, market analysis, and performance presentations.
Usage Points
-
Main Usage
Clearly presents multi-series numerical comparisons across years and categories. Designed to visualize financial results, market share, sales trends, and other complex datasets divided into four segments across three time points, enabling quick trend recognition.
-
How to Use
Enter category names and legend information in the left table area, then adjust bar heights and numerical values in the right chart section to match your data. The hologram gradient background remains fixed while bar colors and value labels can be customized to fit your presentation theme.
-
Recommended For
Recommended for financial reports, quarterly performance reviews, marketing analysis presentations, investor briefings, and business trend analysis. Ideal for CFOs, financial analysts, marketing managers, and executives presenting multi-dimensional data.
-
Slide Structure
Two-slide set: Slide 1 features a light-tone hologram gradient background (magenta→pink→orange→green→yellow) with three-year segmented bar charts; Slide 2 uses a dark-tone background with identical chart structure. Each slide includes a 4×4 reference table on the left and three-year, four-segment bar visualization on the right.
Related Products
-

Structure Presentation Template Segmented Vertical Bar Graph – Market Trends and Performance Analysis
#Market and Competitor Analysis #Financial Plans and Performance #Diagram
-

Segment Chart for Market Trends – Green Orange Theme
#Market and Competitor Analysis #Diagram #Graph
-

Comparison Chart of Pet Expenditure – Essential Template for Competitor Analysis
#Market and Competitor Analysis #Diagram #Graph
-

Analyzing Future Prospect Graphs
#Market and Competitor Analysis #Diagram #Graph
