Competitor Comparison Analysis Graph
RM0100011_12
- Last Update 01/28/2025
- File Size 1MB
- # of Slides 2
- File Format PPTX
- Slide Ratio 16:9
- Color
Keywords
- #Content-Based Slides
- #Design-Based Slides
- #Market and Competitor Analysis
- #Graph
- #Competitor Analysis
- #Competitive Advantage
- #Circles
- #Pie Chart
- #16:9
- #pie chart PowerPoint slide
- #competitor analysis presentation
- #comparison graph template
- #market analysis chart
- #business data visualization
- #how to create pie chart in PowerPoint
About the Product
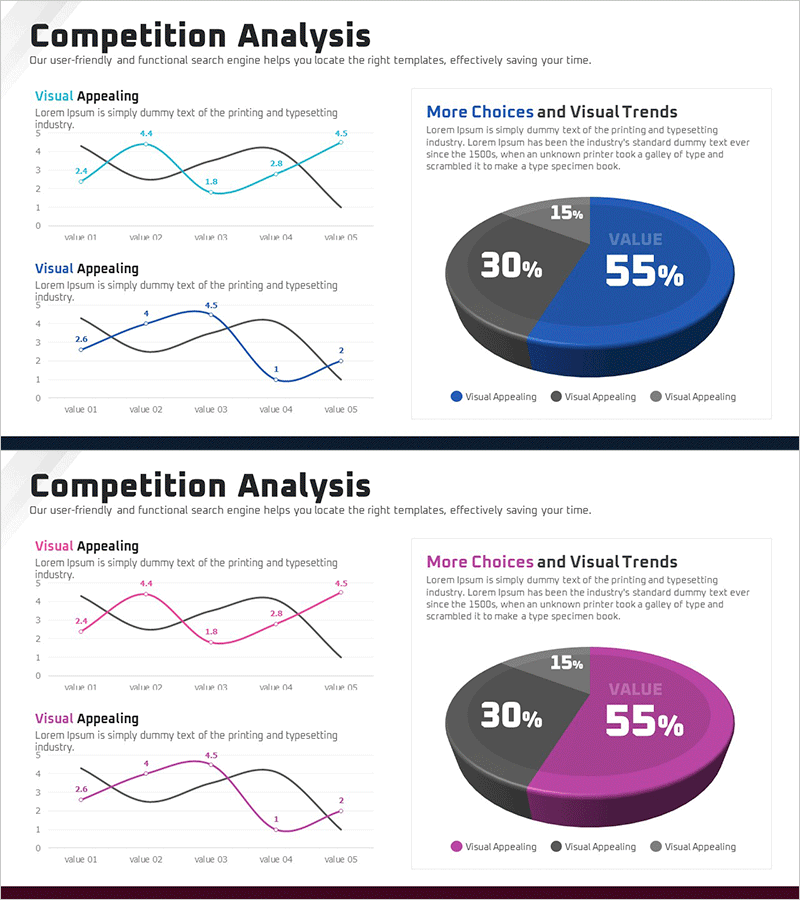
A PowerPoint slide template designed for competitive analysis and market comparison using pie chart visualization. This template combines a three-segment pie chart with a multi-line graph to present competitor performance from multiple perspectives. The design uses contrasting colors—navy blue, magenta, and dark gray—to clearly differentiate data segments, with numerical labels and legend included for immediate presentation use. The 2-slide set in 16:9 widescreen format is optimized for modern business presentations and fully editable for your specific data.
Usage Points
-
Main Usage
Display competitor market share, performance ratios, and customer preferences using pie chart segments. The accompanying line graph shows trend changes over time, providing strategic insights for competitive positioning and business decision-making.
-
How to Use
Insert into executive reports, business plans, or marketing strategy presentations in the market analysis section. Replace pie chart segments and line graph data with your own figures, then update title and legend text to match your presentation context.
-
Recommended For
Executives, marketing managers, business development teams, management consultants, and investor relations professionals presenting competitive landscape analysis to boards, investors, and stakeholders. Ideal for market share comparison, competitive strength assessment, and strategic positioning discussions.
-
Slide Structure
Slide 1: Title area with 3-segment pie chart (55% navy blue, 30% dark gray, 15% magenta) and legend. Slide 2: Identical pie chart layout with dual-series line graph (5 data points per series) showing competitive trends. All text labels and numerical values are fully editable text boxes.
Related Products
-

Camping Isometric Business Competitor Pie Chart Analysis
#Market and Competitor Analysis #Graph #Competitor Analysis
-

Comparison Pie Chart by Subject – Emphasizing Competitive Advantage
#Market and Competitor Analysis #Graph #Competitor Analysis
-

Cartoon Theme Analysis Donut Circle Graph – Visualizing Market Competitiveness
#Market and Competitor Analysis #Graph #Competitor Analysis
-

Third Party Comparison Analysis Line Graph – Highlighting Market Competitiveness
#Market and Competitor Analysis #Graph #Competitor Analysis
