Camping Isometric Business Competitor Pie Chart Analysis
RJ0600078_5
- Last Update 07/11/2025
- File Size 0.8MB
- # of Slides 2
- File Format PPTX
- Slide Ratio 16:9
- Color
Keywords
- #Content-Based Slides
- #Design-Based Slides
- #Market and Competitor Analysis
- #Graph
- #Competitor Analysis
- #Competitive Advantage
- #Circles
- #Pie Chart
- #16:9
- #pie chart PowerPoint slide
- #3D pie chart template
- #competitor analysis presentation
- #market share visualization
- #isometric chart design
- #data visualization slides
About the Product
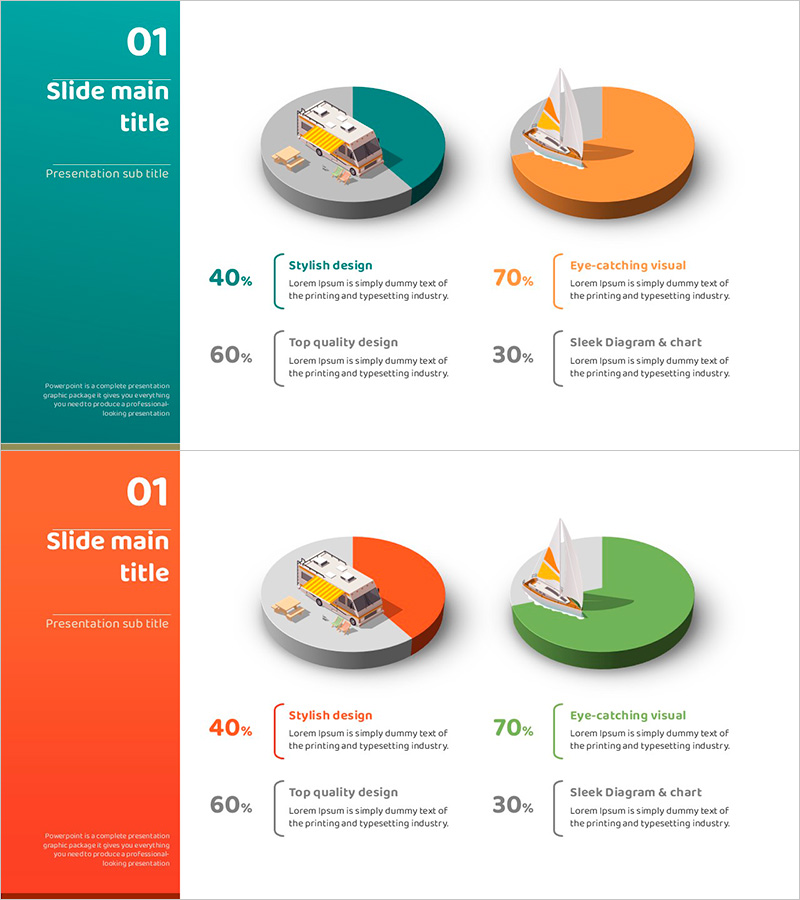
A 3D isometric pie chart PowerPoint slide set designed for camping and outdoor industry market analysis. This 2-slide presentation features three-dimensional pie charts in teal, orange, and green color schemes to visualize market share, competitive positioning, and customer satisfaction metrics. Each slide combines 3D mockup imagery with percentage values and descriptive text to capture audience attention during presentations. The 16:9 widescreen PPTX format is fully editable and ready to use in marketing reports, business analysis documents, investor pitch decks, and strategic planning presentations.
Usage Points
-
Main Usage
Ideal for presenting market share distribution, competitive positioning, customer satisfaction ratios, and product composition percentages using 3D pie chart visualization. Specifically designed for camping and outdoor industry analysis to communicate competitive landscape at a glance.
-
How to Use
Input percentage values directly into each pie chart section and update legend text with competitor names or category labels. Replace 3D mockup images to match your industry context, and adjust color schemes to align with corporate branding guidelines. Present each section with detailed explanation to enhance audience comprehension during delivery.
-
Recommended For
Marketing professionals, business analysts, investor relations specialists, market research report writers, executive presentation teams, consulting firms, and industry analysts presenting competitive analysis and market overview data.
-
Slide Structure
2-slide layout. Slide 1: Teal sidebar on left + center 3D pie chart (3-segment) + right orange pie chart (3-segment) + percentage values and descriptive text per section. Slide 2: Orange sidebar on left + center 3D pie chart (3-segment) + right green pie chart (3-segment) + matching layout structure. 16:9 widescreen format.
Related Products
-

Comparison Pie Chart by Subject – Emphasizing Competitive Advantage
#Market and Competitor Analysis #Graph #Competitor Analysis
-

Competitor Comparison Analysis Graph
#Market and Competitor Analysis #Graph #Competitor Analysis
-

Red Blue Area Chart – Market and Competitor Analysis
#Market and Competitor Analysis #Graph #Competitor Analysis
-

Business Analysis Chart – Visualizing Competitive Advantage
#Market and Competitor Analysis #Graph #Other
