Variation Graph for the Line Chart – Optimized Design for Market and Competitor Analysis
RJ0900025_23
- Last Update 08/30/2025
- File Size 0.5MB
- # of Slides 2
- File Format PPTX
- Slide Ratio 16:9
- Color
Keywords
About the Product
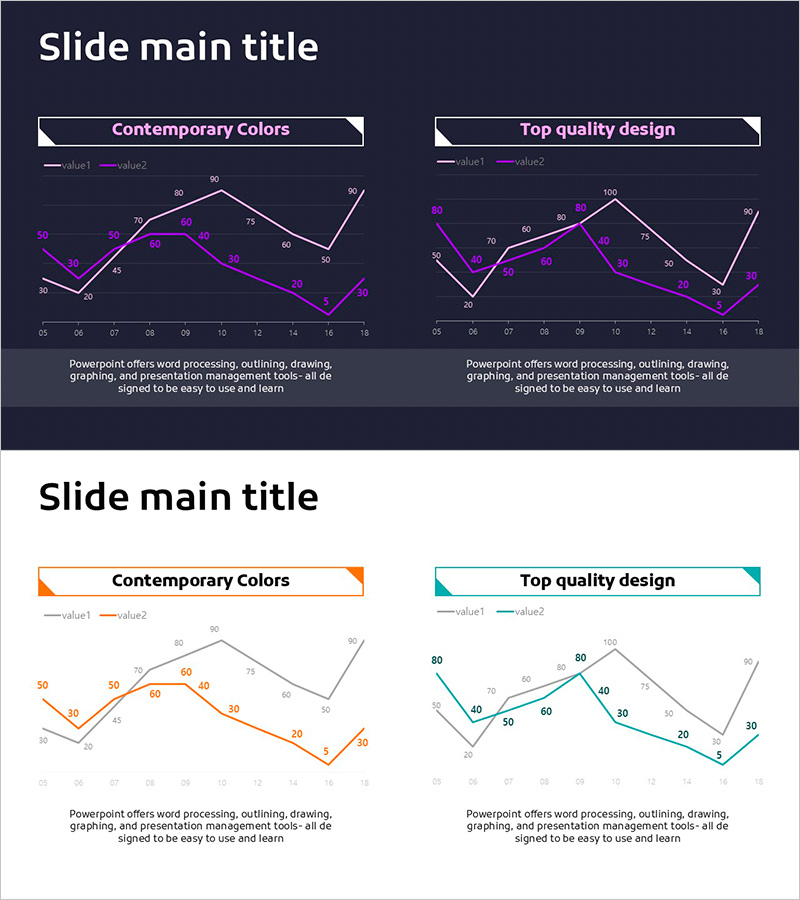
A multi-series line chart PowerPoint slide that visualizes two data streams simultaneously, ideal for market analysis and competitive benchmarking. The dark-background version features purple and magenta lines with 16 data points spanning periods 05–18, while the light-background version uses orange and teal lines for contrast. Both slides include axis labels, legend, and gridlines for clear trend interpretation. Fully editable in PPTX format (16:9, 2 slides), allowing you to customize data values, series names, and colors to match your presentation theme.
Usage Points
-
Main Usage
Compares two data series over time to reveal relative performance, growth rates, or market dynamics. Ideal for presenting market share vs. competitor share, actual revenue vs. forecast, customer satisfaction vs. industry benchmark, or any scenario requiring side-by-side trend analysis.
-
How to Use
Double-click the chart to enter edit mode. Update data values in the underlying table, modify series names (value1, value2) to match your metrics, and adjust line colors via the chart formatting options. Add or remove data points by expanding the data range. Exit edit mode to apply changes to the slide.
-
Recommended For
Executive presentations, quarterly business reviews, market research reports, investor pitch decks, and consulting proposals. Best suited for C-suite executives, business analysts, marketing strategists, sales leaders, and management consultants presenting competitive or performance analysis.
-
Slide Structure
Two-slide set with identical data structure (16 points, periods 05–18, Y-axis 0–100) but contrasting color schemes. Dark slide: purple and magenta lines on charcoal background. Light slide: orange and teal lines on white background. Both include legend, axis labels, and gridlines for professional presentation.
Related Products
-

Blue Green Broken Line Graph – Competitor Analysis
#Market and Competitor Analysis #Graph #Competitor Analysis
-

Competitor Comparison Broken Line Highlight Graph
#Market and Competitor Analysis #Graph #Competitor Analysis
-

Competitor Idea Analysis Graph
#Market and Competitor Analysis #Graph #Competitor Analysis
-

Market Competitiveness Comparison Graph – Highlighting Competitive Advantage
#Market and Competitor Analysis #Graph #Competitor Analysis
