Comparison Pie Chart by Subject – Emphasizing Competitive Advantage
RJ0500012_15
- Last Update 06/10/2025
- File Size 0.5MB
- # of Slides 2
- File Format PPTX
- Slide Ratio 16:9
- Color
Keywords
About the Product
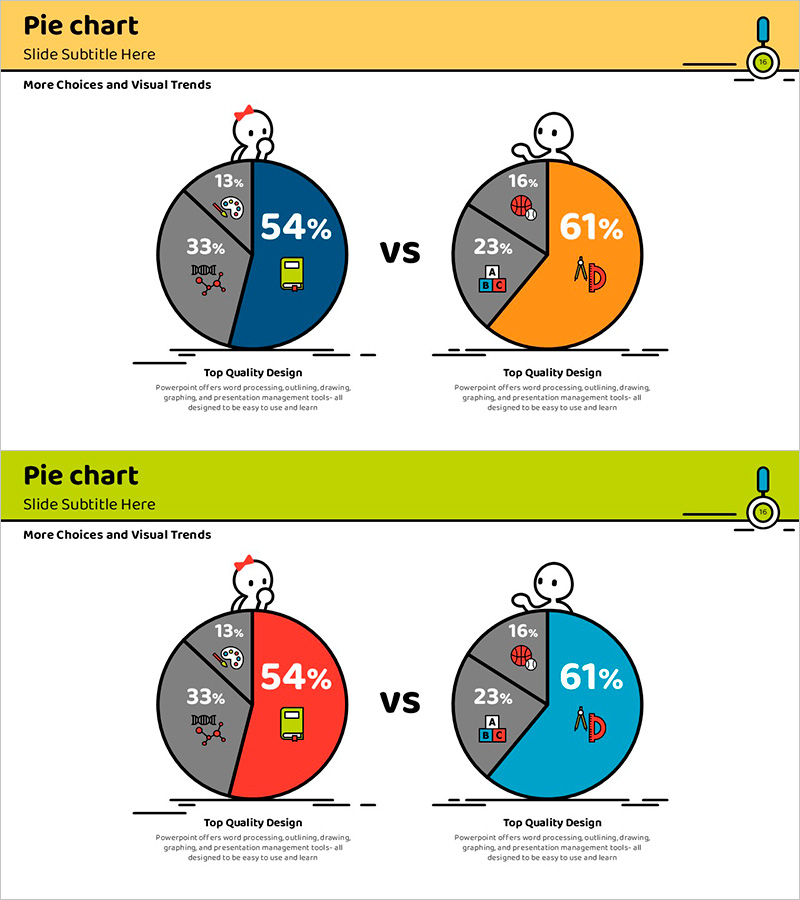
A side-by-side pie chart PowerPoint slide comparing composition ratios of two items. Two circular charts in navy blue and orange color schemes are arranged in a 'vs' layout to visually represent competitive advantage, market share, preference comparison, and more. Each chart is divided into 3–4 segments with icons and percentage labels for immediate use in presentations and reports. Provided in 16:9 widescreen format across 2 slides, with fully editable colors, data values, and text fields.
Usage Points
-
Main Usage
Compares composition ratios of two alternatives, products, or markets simultaneously. Ideal for competitive positioning analysis, customer preference comparison, market share benchmarking, and technology stack evaluation to visualize decision-making evidence.
-
How to Use
Insert into business plans, marketing proposals, investor pitch decks, and quarterly performance reports in market analysis and competitive analysis sections. Replace segment percentages and icons with actual data, and customize titles and legends to match presentation context.
-
Recommended For
Marketing managers, business development professionals, financial analysts, consultants, and executives preparing comparative reports. Recommended for all presentation scenarios requiring competitive analysis, market research, customer segmentation, and portfolio comparison.
-
Slide Structure
Two pie charts per slide arranged side-by-side. Each chart divided into 3–4 segments with primary metrics (54%, 61%, etc.) prominently displayed in the center. Icon illustrations above each chart, 'Top Quality Design' caption and descriptive text area below. Both slides follow identical structure with color variation (navy/orange vs. red/cyan).
Related Products
-

Camping Isometric Business Competitor Pie Chart Analysis
#Market and Competitor Analysis #Graph #Competitor Analysis
-

Competitor Comparison Analysis Graph
#Market and Competitor Analysis #Graph #Competitor Analysis
-

3 Competitive Advantage Graphs – Market and Competitor Analysis
#Market and Competitor Analysis #Graph #Competitor Analysis
-

Line Graph with Sales Change – Competitor Advantage Analysis
#Market and Competitor Analysis #Graph #Competitor Analysis
