Sales and Profit Table – Clear Financial Planning
RM0100010_32
- Last Update 01/28/2025
- File Size 1MB
- # of Slides 2
- File Format PPTX
- Slide Ratio 16:9
- Color
Keywords
About the Product
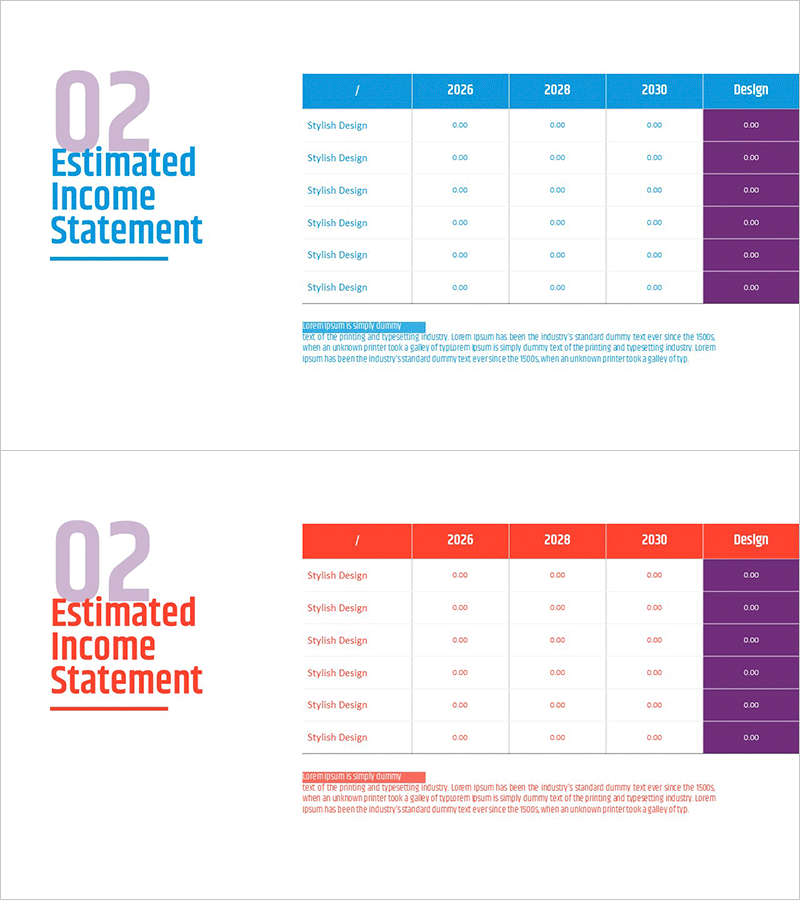
A financial data visualization PowerPoint slide presenting an estimated income statement with year-over-year comparison. The slide features a structured table format comparing figures for 2026, 2028, and 2030, with a clear left-side title area and right-side data table layout. The design uses a blue header with purple accent columns in one version and a red header with purple accents in the alternative version, allowing you to match your corporate branding. This presentation slide is ready to use in investor presentations, business plan pitches, and financial reports.
Usage Points
-
Main Usage
Present financial forecast data in a structured table format to decision-makers and investors, enabling them to quickly assess revenue projections and business growth potential. The year-over-year layout facilitates trend analysis and performance comparison.
-
How to Use
Insert this slide into the financial section of investor presentations, business plans, or financial reports. Add your slide number and section title in the left title area, then populate each table cell with your actual financial figures.
-
Recommended For
CFOs, finance managers, business development teams, and investor relations professionals presenting financial performance. Ideal for startup pitch decks, corporate business plan presentations, and financial analysis reports.
-
Slide Structure
Two-slide set with blue header and red header versions, each featuring purple design columns. Layout divides the slide into a left title area (approximately 30% width) and right data table (approximately 70% width). The table contains 6 rows including header and 5 columns for year labels and three fiscal years plus design column.
Related Products
-

Table Chart and Descriptive Text – Visualizing Sales Metrics
#Financial Plans and Performance #Diagram #Sales and Revenue
-

Orange Red Point Table – Visualization of Financial Performance
#Financial Plans and Performance #Diagram #Sales and Revenue
-

Capital Sales Analysis Graph – Visualizing Financial Performance
#Financial Plans and Performance #Diagram #Graph
-

Sales and Profit Table – Statistical Financial Performance
#Financial Plans and Performance #Diagram #Sales and Revenue
