Market Distribution Analysis Positioning Map – Strengthening Competitiveness
RM0100006_25
- Last Update 01/26/2025
- File Size 0.3MB
- # of Slides 2
- File Format PPTX
- Slide Ratio 16:9
- Color
Keywords
- #Content-Based Slides
- #Design-Based Slides
- #Market and Competitor Analysis
- #Marketing Plan and Strategy
- #Diagram
- #Graph
- #Other
- #Market Analysis
- #Positioning
- #Table
- #16:9
- #positioning map PowerPoint slide
- #market analysis chart template
- #2-axis 4-quadrant analysis slide
- #competitive positioning PPT
- #marketing strategy analysis template
About the Product
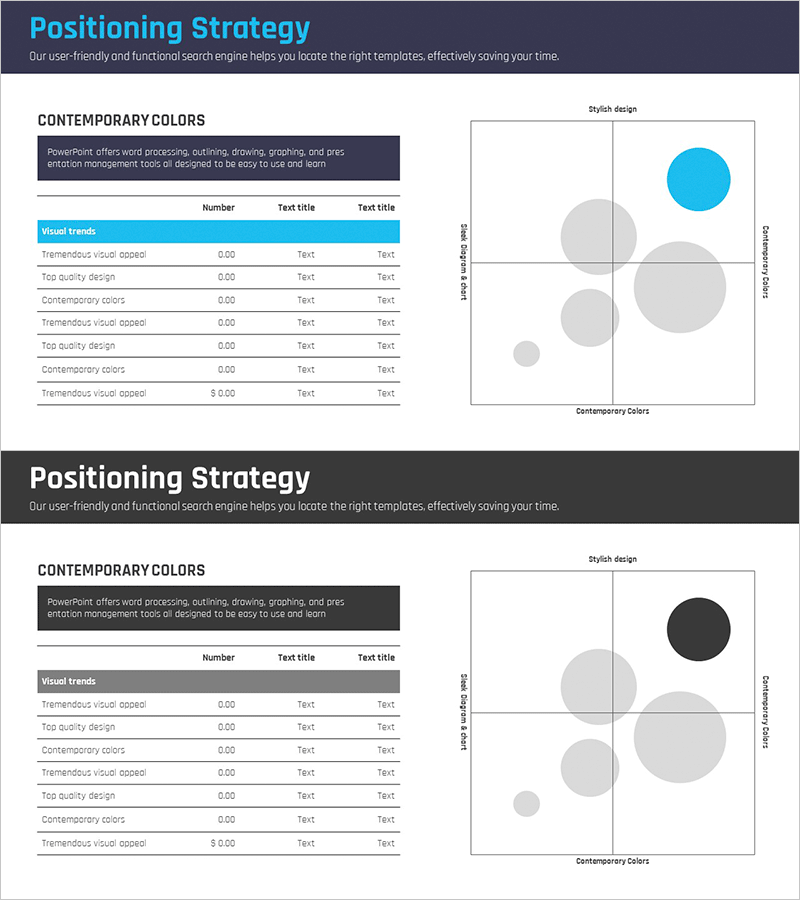
A professional positioning map PowerPoint slide essential for market analysis and competitive strategy development. This 2-slide set features a light-tone layout with blue circular elements on the first slide and a dark-tone layout with black circular elements on the second. Each slide combines a data input table on the left with a 2-axis 4-quadrant chart area on the right, enabling intuitive visualization of market positioning, competitor analysis, and target market segmentation. Ideal for the market analysis section of business presentations, this slide effectively presents numerical data and visual representation simultaneously to support strategic decision-making and competitive positioning discussions.
Usage Points
-
Main Usage
Visualize market positioning and competitive landscape using a 2-axis 4-quadrant framework to support strategic decision-making in market analysis and competitive strategy phases. Effectively communicate market conditions and competitive advantage enhancement strategies in investor presentations, executive briefings, and marketing planning meetings.
-
How to Use
Enter competitor names, evaluation metrics, and numerical data in the left table; the right quadrant chart automatically positions them accordingly. Customize axis labels (e.g., price-quality, technology-market share) to represent different analytical perspectives, and adjust circle sizes to indicate market scale or revenue.
-
Recommended For
Marketing strategy managers, business development teams, executive presentation specialists, investor relations professionals, market research analysts, and new business planners presenting competitive environment analysis and positioning strategies.
-
Slide Structure
2-slide format. Each slide contains a header section (title and description), a data input table on the left (rows for competitors/items, columns for metrics/values), and a 2-axis 4-quadrant chart area on the right with circular positioning elements. Two color options (light and dark tones) available for different presentation contexts.
Related Products
-

Strategic Positioning Map – Market Analysis and Marketing Strategy
#Market and Competitor Analysis #Marketing Plan and Strategy #Diagram
-

Artificial Intelligence Development Market Positioning Map – Effective Visual Data Comparison
#Market and Competitor Analysis #Marketing Plan and Strategy #Diagram
-

Positioning Analysis Chart – Market Competitiveness Strategy
#Market and Competitor Analysis #Marketing Plan and Strategy #Diagram
-

Business Market Positioning Strategy Slide – Competitive Analysis
#Market and Competitor Analysis #Marketing Plan and Strategy #Diagram
