Positioning Image Map Graph – Effective Visualization for Market Analysis
RM0100009_25
- Last Update 01/27/2025
- File Size 1.1MB
- # of Slides 2
- File Format PPTX
- Slide Ratio 16:9
- Color
Keywords
- #Content-Based Slides
- #Design-Based Slides
- #Market and Competitor Analysis
- #Marketing Plan and Strategy
- #Graph
- #Other
- #Market Analysis
- #Positioning
- #16:9
- #positioning PowerPoint slide
- #positioning strategy chart
- #market analysis slide
- #competitive positioning template
- #how to create positioning map in PowerPoint
About the Product
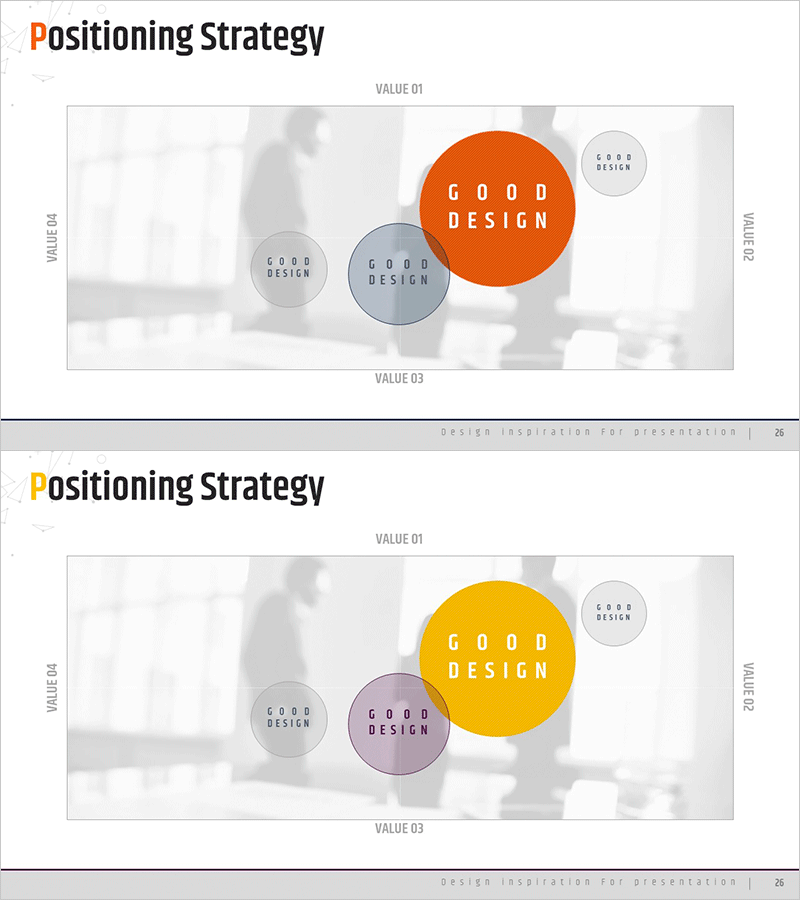
A 2-slide PowerPoint template for visualizing market positioning strategy using a four-value comparative layout. Features orange, yellow, and gray circular elements positioned along VALUE 01-03 axes to clearly show your company's position relative to competitors. Delivered in 16:9 widescreen PPTX format, fully editable and ready for immediate use in marketing strategy presentations, competitive analysis, and positioning planning decks. The infographic approach combines background imagery with circular chart elements to communicate complex market data intuitively.
Usage Points
-
Main Usage
Clearly articulate your company's market position relative to competitors using a multi-dimensional value comparison framework. The two-dimensional positioning map format effectively communicates strategic differentiation to investors, stakeholders, and partners with visual impact.
-
How to Use
Insert this slide into the market analysis section of marketing plans, business proposals, or investor pitch decks. Customize the circular elements' size, color, and position to highlight competitive advantages, and add text labels to identify each value dimension. Adapt the VALUE axes to match your specific market analysis criteria.
-
Recommended For
Marketing managers, strategy teams, C-suite executives, product launch presentations, market entry strategy meetings, competitive analysis reports, and investor relations materials. Particularly effective for B2B business model explanations and market segmentation strategy development.
-
Slide Structure
Two-slide layout with 3-4 circular value indicators positioned on a background image per slide. Includes 5-6 text input areas for title, VALUE axis labels, and circular element text. Designed as a comparative information hierarchy, allowing flexible customization for various positioning scenarios and market analysis frameworks.
Related Products
-

Price Quality Positioning Map – Market and Competitor Analysis
#Market and Competitor Analysis #Marketing Plan and Strategy #Diagram
-

Market Distribution Analysis Positioning Map – Strengthening Competitiveness
#Market and Competitor Analysis #Marketing Plan and Strategy #Diagram
-

Positioning Strategy Circle Graph
#Market and Competitor Analysis #Marketing Plan and Strategy #Graph
-

Positioning Analysis Graph – Visualizing Market and Competition
#Market and Competitor Analysis #Marketing Plan and Strategy #Graph
