Area Curve Graph for Market Analysis and Strategy Visualization
RM0100010_16
- Last Update 09/01/2025
- File Size 1MB
- # of Slides 4
- File Format PPTX
- Slide Ratio 16:9
- Color
Keywords
- #Content-Based Slides
- #Design-Based Slides
- #Market and Competitor Analysis
- #Marketing Plan and Strategy
- #Graph
- #Market Analysis
- #Positioning
- #Other
- #Other Charts
- #16:9
- #area graph PowerPoint
- #curve chart slide template
- #market analysis presentation
- #competitive analysis slide
- #area chart PPT download
- #data visualization slides
About the Product
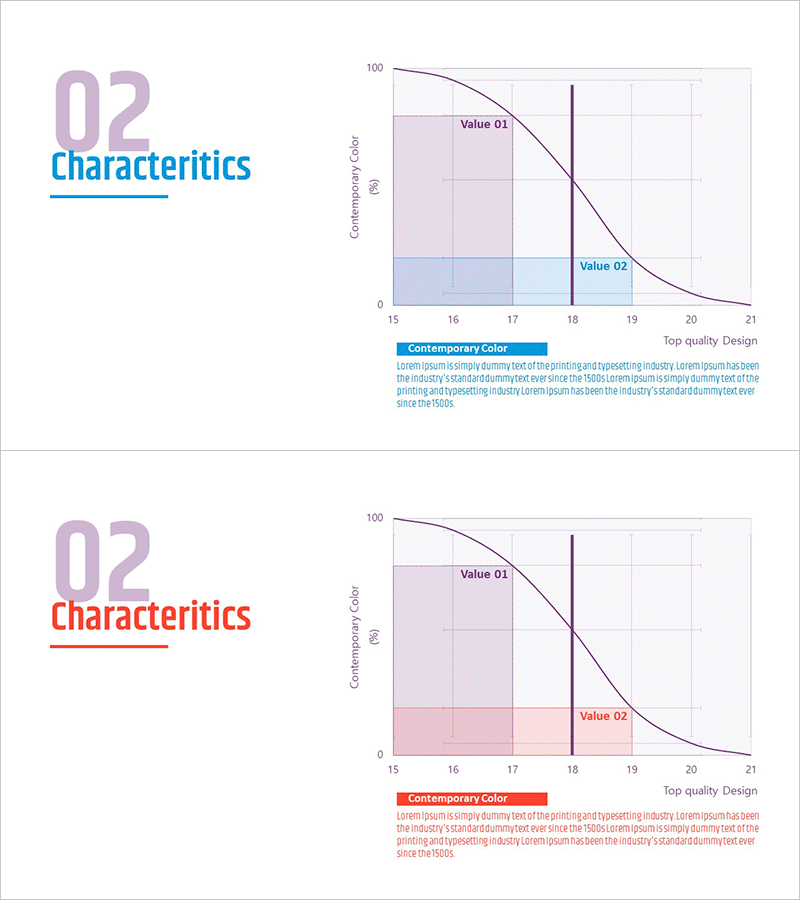
A professional area curve graph PowerPoint slide designed for market analysis and competitive strategy visualization. The slide features two data series (Value 01 and Value 02) rendered in blue and pink gradient areas, with a clear grid background and labeled axes for optimal data readability. The 4-slide set presents the same graph structure in multiple color combinations (blue-pink and blue-purple variants), making it ready for immediate use in business presentations, quarterly reports, and strategic planning documents. Fully editable in all PowerPoint versions with 16:9 widescreen format and PPTX compatibility.
Usage Points
-
Main Usage
Visualize comparative trends between two or more data series over time or across categories, such as market size evolution, competitor market share changes, or customer satisfaction metrics. The overlapping area effect enables simultaneous comparison of relative magnitudes and trend trajectories, making it ideal for strategic planning and competitive positioning analysis.
-
How to Use
Replace the Value 01 and Value 02 labels and numerical data with your own metrics. Adjust the axis range (15–21) and gridlines to match your data scale, and select from four color combination variants or customize further as needed. Insert into business plans, marketing strategy documents, quarterly performance reports, or investor presentations.
-
Recommended For
Marketing managers, strategy consultants, business analysts, sales executives, and C-level presenters explaining competitive landscape, market share trends, customer segment performance, or revenue forecasts. Suitable for board meetings, investor pitches, and strategic review sessions.
-
Slide Structure
4-slide set with identical area curve graph structure presented in two color schemes. Each slide contains Y-axis (Consistency Color, 0–100%), X-axis (range 15–21), two gradient-filled area series (Value 01 and Value 02), legend, title area, and supporting text zones optimized for 16:9 widescreen display.
Related Products
-

Triangle Pattern Radial Chart – Optimal Data Visualization for Market Analysis
#Market and Competitor Analysis #Marketing Plan and Strategy #Graph
-

Positioning Analysis Graph – Visualizing Market and Competition
#Market and Competitor Analysis #Marketing Plan and Strategy #Graph
-

Segmented Square 3D Graph: Market & Competitive Analysis
#Market and Competitor Analysis #Graph #Other
-

Wellness Value Positioning Slide – Market Analysis and Marketing Strategy
#Market and Competitor Analysis #Marketing Plan and Strategy #Diagram
