Competitive Advantage Analysis Graph – Market and Competitor Analysis
RJ0400061_11
- Last Update 06/03/2025
- File Size 0.3MB
- # of Slides 2
- File Format PPTX
- Slide Ratio 16:9
- Color
Keywords
- #Content-Based Slides
- #Design-Based Slides
- #Market and Competitor Analysis
- #Graph
- #Competitor Analysis
- #Competitive Advantage
- #Line
- #Line Chart
- #16:9
- #line chart PowerPoint slide
- #dual-series trend comparison
- #competitive analysis chart
- #business data visualization
- #how to create line chart in PowerPoint
About the Product
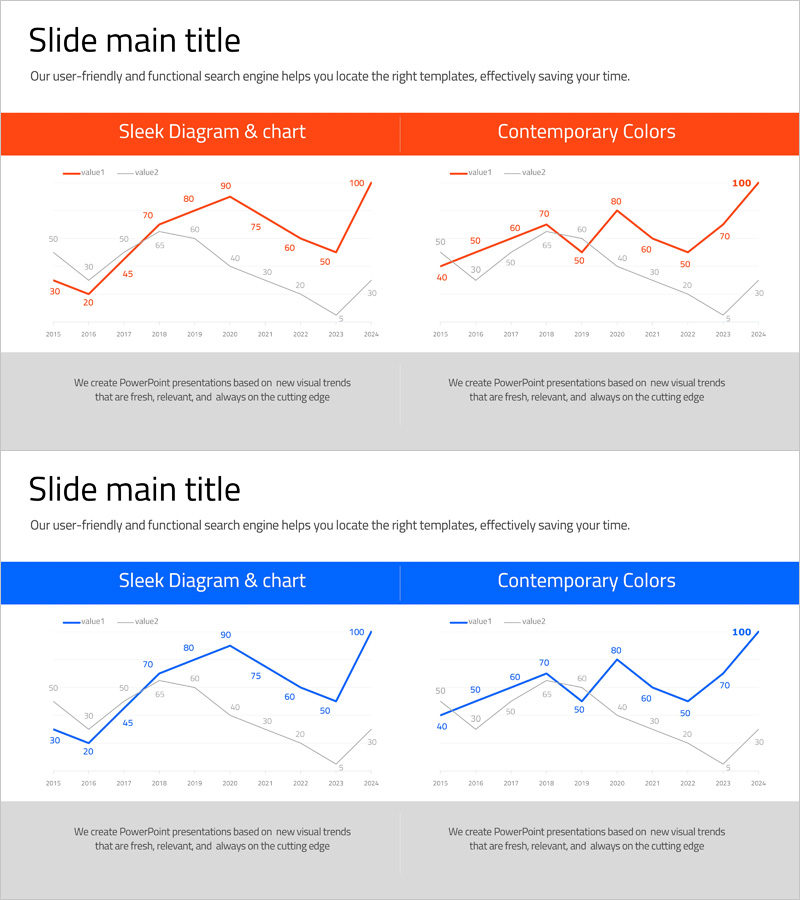
A dual-series line chart PowerPoint slide optimized for competitive analysis and business data visualization. The chart features orange and blue trend lines representing two data series from 2015 to 2024, enabling direct comparison of competitor performance versus company metrics. Each data point is labeled with numerical values for precise information delivery. This presentation template effectively communicates market trends, competitive advantage analysis, revenue growth, and other key business indicators in reports and pitch decks.
Usage Points
-
Main Usage
Compares two data series over time to analyze trends and performance metrics. Ideal for displaying competitive advantage analysis, market share evolution, revenue trends, and other business KPIs by overlaying two trend lines for direct comparison.
-
How to Use
Insert into the market analysis section of business presentations or performance analysis pages of executive reports. Replace data values with actual figures, update legend labels and axis titles to match your presentation context, and the slide is ready to use immediately.
-
Recommended For
Executive reports, investor presentations (IR), business plans, marketing strategy documents, quarterly performance reviews. Recommended for executives, marketing managers, business development teams, and financial analysts who need to present competitive analysis and trend comparisons.
-
Slide Structure
Two slides featuring dual-series line charts with orange and blue trend lines. X-axis spans 2015–2024 (10-year period) and Y-axis ranges from 0–100. Each data point displays numerical labels for accurate value comparison and trend analysis.
Related Products
-

Competitor Comparison Broken Line Highlight Graph
#Market and Competitor Analysis #Graph #Competitor Analysis
-

Competitive Advantage Broken Line Graph – Market and Competition Analysis
#Market and Competitor Analysis #Graph #Competitor Analysis
-

Competitor Product Competitive Advantage Analysis Graph – Market Trends Visualization
#Market and Competitor Analysis #Graph #Competitor Analysis
-

Market Competitiveness Comparison Graph – Highlighting Competitive Advantage
#Market and Competitor Analysis #Graph #Competitor Analysis
