Competitive Advantage Analysis Graph – Market and Competitor Analysis
RJ0400058_15
- Last Update 06/02/2025
- File Size 0.2MB
- # of Slides 2
- File Format PPTX
- Slide Ratio 16:9
- Color
Keywords
- #Content-Based Slides
- #Design-Based Slides
- #Market and Competitor Analysis
- #Graph
- #Competitor Analysis
- #Competitive Advantage
- #Line
- #Line Chart
- #16:9
- #multi-line chart PowerPoint
- #trend analysis slide template
- #competitive analysis presentation
- #line graph PPT download
- #market comparison chart
- #how to create line chart in PowerPoint
About the Product
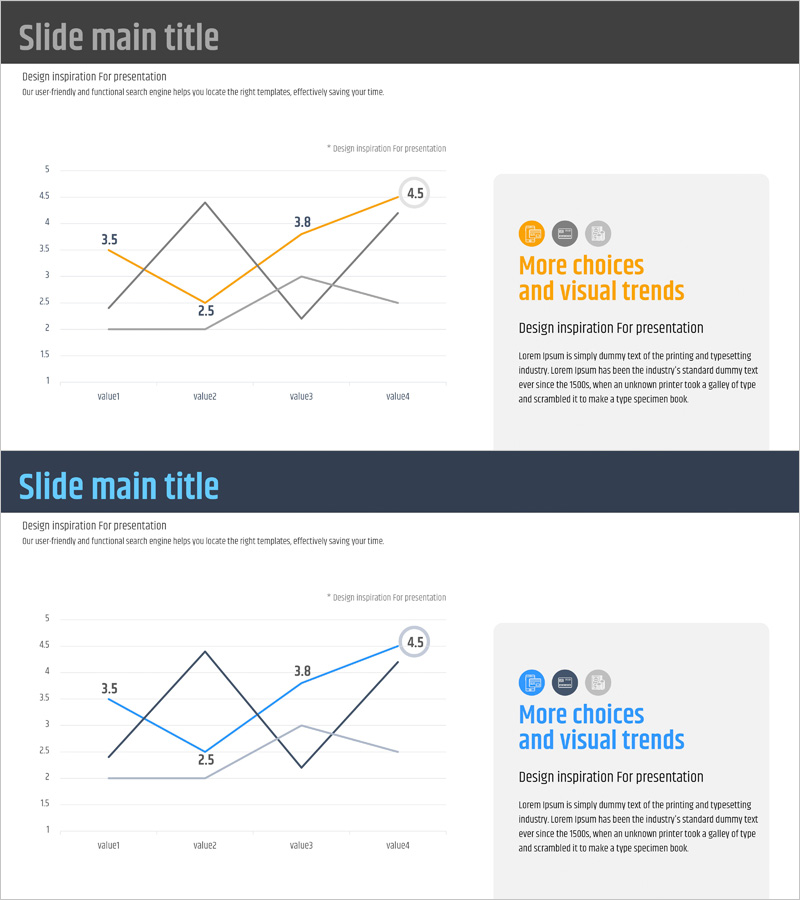
A multi-line chart PowerPoint slide designed to visualize competitive advantage analysis and market trends. This presentation template displays four data series simultaneously, enabling clear comparison of competitor performance and market dynamics. The chart features orange and black line series with labeled data points at each intersection, ensuring precise information delivery. The slide includes a text area with icon placeholders for additional insights or key messages. Fully editable PPTX format, ready for business reports, competitive analysis presentations, investor pitches, and strategic planning meetings.
Usage Points
-
Main Usage
Ideal for comparing competitor performance trajectories and market changes over time. The four-line structure allows simultaneous visualization of multiple metrics, supporting data-driven decision-making in executive briefings, investor presentations, and strategic planning sessions.
-
How to Use
Replace the default data points (value1–value4) with your actual figures. Update the legend labels to reflect competitor names or metric titles, and adjust line colors and styles to match your corporate branding. The 16:9 widescreen format is optimized for large-screen presentations and digital displays.
-
Recommended For
Executives, strategy managers, market analysts, financial officers, consultants, and business development professionals. Particularly effective for quarterly and annual performance comparisons, competitive benchmarking, market share trend analysis, and investor relations materials.
-
Slide Structure
Two-slide set, each featuring a 4-series line chart with Y-axis range 1–5 and X-axis with four data points. Numeric labels appear at each intersection. The right side includes three icon placeholders and a text area for additional commentary or key takeaways.
Related Products
-

Competitor Comparative Analysis Slide – Emphasizing Market and Competitiveness
#Market and Competitor Analysis #Graph #Text Box
-

Market Competitiveness Comparison Graph – Highlighting Competitive Advantage
#Market and Competitor Analysis #Graph #Competitor Analysis
-

Competitive Advantage Broken Line Graph – Market and Competition Analysis
#Market and Competitor Analysis #Graph #Competitor Analysis
-

Blue Green Broken Line Graph – Competitor Analysis
#Market and Competitor Analysis #Graph #Competitor Analysis
