Bar Chart of Bike Exercise – Market Trends and Future Outlook
RJ0600012_14
- Last Update 06/24/2025
- File Size 0.3MB
- # of Slides 2
- File Format PPTX
- Slide Ratio 16:9
- Color
Keywords
- #Content-Based Slides
- #Design-Based Slides
- #Market and Competitor Analysis
- #Graph
- #Future Outlook
- #Industry Trends
- #Horizontal Bar
- #Segmented Horizontal Bar
- #16:9
- #horizontal bar chart PowerPoint
- #bar graph slide template
- #market trends chart
- #data comparison graph
- #3-series bar chart PowerPoint slide
About the Product
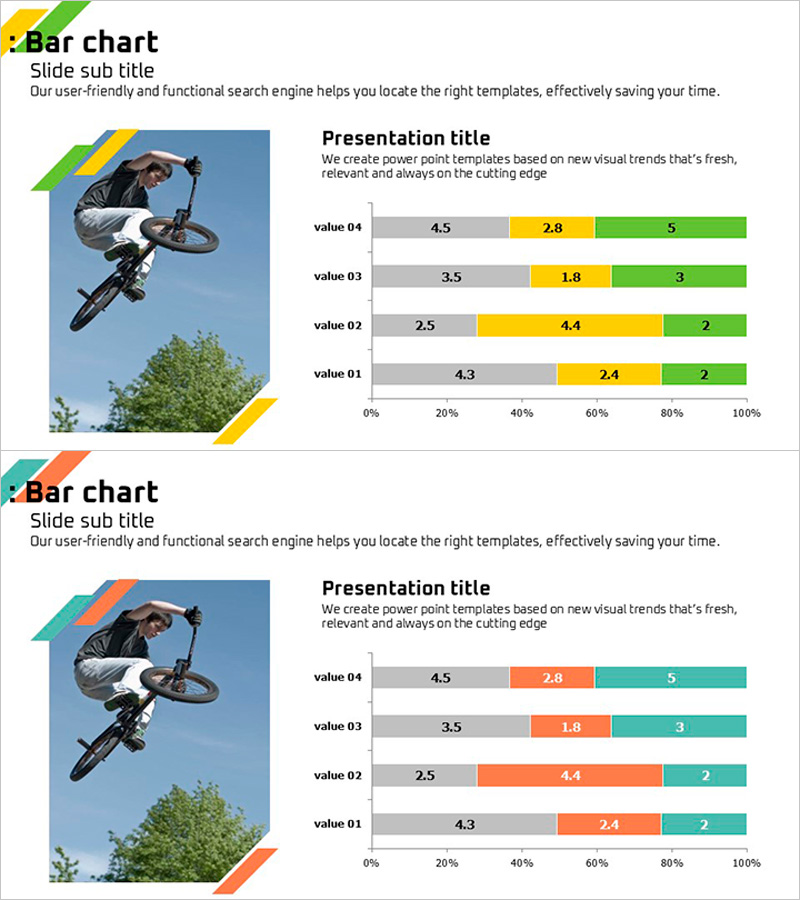
A horizontal bar chart PowerPoint slide designed for analyzing the bike exercise market with three data series. The chart uses gray, orange, and teal colors to distinguish between data categories, displaying four items with values ranging from 0 to 100%. Each bar includes precise numerical labels, making it ideal for market trend analysis, future outlook presentations, and competitive comparisons. The 2-slide set offers two color variations, allowing you to match your presentation's visual identity. The layout provides clear data visualization for business reports, marketing plans, and investor presentations.
Usage Points
-
Main Usage
This slide is optimized for presenting numerical data across three categories simultaneously, such as market size, growth rate, and customer satisfaction in the bike exercise industry. It enables clear visualization of current market conditions and future projections, providing a solid foundation for strategic decision-making.
-
How to Use
Use this slide in business reports, marketing presentations, and investor pitch decks to compare market analysis data. Simply edit the numerical values, item labels, and legend text with your own data. Choose the color variation that best matches your presentation's brand identity from the two provided options.
-
Recommended For
Ideal for market analysts, marketing professionals, executives, management consultants, and startup founders preparing data-driven presentations. Particularly effective when comparing three or more categories (time periods, regions, product lines) simultaneously in a single visualization.
-
Slide Structure
The 2-slide set presents identical data structures in two color schemes: gray-orange-teal and gray-orange-teal variations. Each slide displays 4 items (value 01–04) with 3 data series as horizontal bars scaled from 0 to 100%, complete with precise numerical labels and percentage scale indicators.
Related Products
-

National Trend Change Graph Visualization – Horizontal Bar Chart
#Market and Competitor Analysis #Graph #Other
-

Plant Cultivation Awareness Graph – Visualizing Market Status with Horizontal Bar
#Market and Competitor Analysis #Graph #Market Status
-

Comparison of Fruit Consumption – Market Trend Analysis
#Market and Competitor Analysis #Financial Plans and Performance #Graph
-

Year-by-Year Breakdown Comparison Analysis Graph
#Market and Competitor Analysis #Graph #Future Outlook
