Rise and Fall Vertical Bar Graph – Essential for Market Analysis
RJ0600027_13
- Last Update 06/27/2025
- File Size 0.2MB
- # of Slides 2
- File Format PPTX
- Slide Ratio 16:9
- Color
Keywords
About the Product
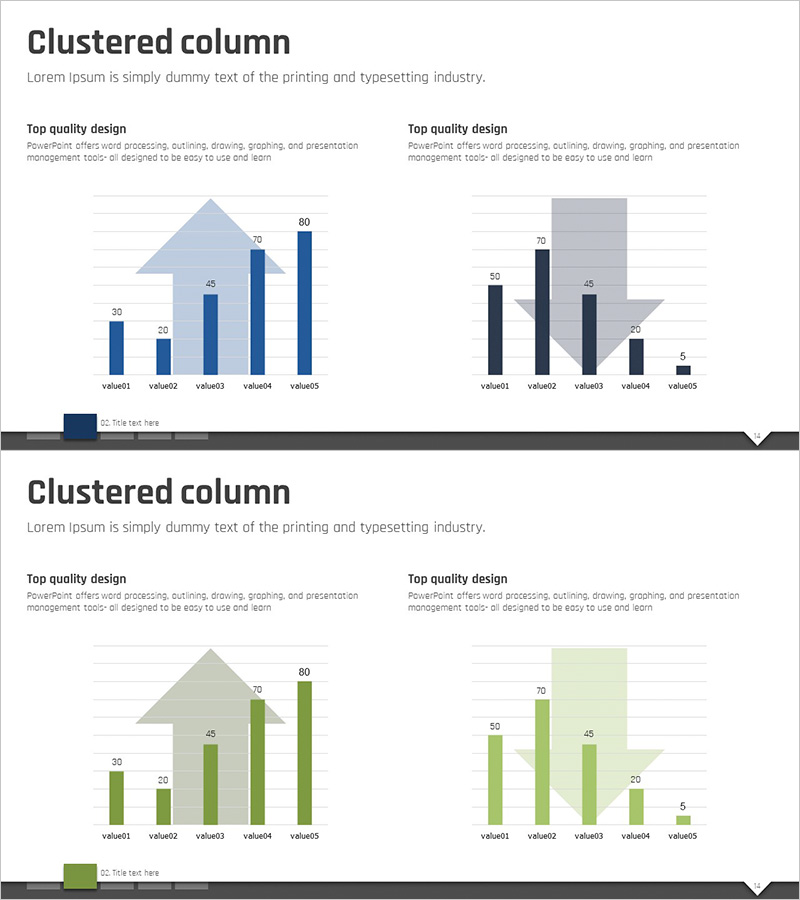
A vertical bar chart PowerPoint slide optimized for market analysis and competitive comparison. The left slide displays a single blue data series across 5 items showing numerical trends, while the right slide presents dual series in black and gray for simultaneous two-group comparison. Numerical labels appear clearly above each bar, and triangular arrow icons intuitively convey upward and downward trends. This presentation template is ready to use for company performance analysis, market share comparison, and competitive analysis reports.
Usage Points
-
Main Usage
Visualizes upward and downward trends in numerical data for market analysis, performance comparison, and competitive benchmarking. Two layout options support both single-series trend analysis and multi-series comparative analysis, with triangular arrows indicating directional change intuitively.
-
How to Use
Use the left slide for single data series trend visualization and the right slide for parallel comparison of two data groups. Replace numerical values with your own data and modify item labels (value01–value05) as needed for immediate presentation use.
-
Recommended For
Recommended for marketing managers, sales analysts, financial reporting specialists, and executives preparing performance reports. Ideal for quarterly performance reviews, market research presentations, competitive analysis reports, and business performance analysis presentations.
-
Slide Structure
2-slide set. Slide 1: Single-series vertical bar chart in blue (5 items, values 30–80). Slide 2: Dual-series vertical bar chart in black and gray (5 items, values 5–70). Numerical labels positioned above each bar; triangular arrows indicate upward/downward direction. 16:9 widescreen format, PPTX file.
Related Products
-

Business Future Outlook Analysis Diagram - Market Analysis and Competitive Advantage
#Market and Competitor Analysis #Graph #Future Outlook
-

Future Outlook Bar Graph – Visualizing Market Growth
#Market and Competitor Analysis #Graph #Future Outlook
-

Future Outlook Vertical Bar Graph – Market Analysis
#Market and Competitor Analysis #Graph #Future Outlook
-

Market Analysis Comparison Graph – Insights into Future Trends
#Market and Competitor Analysis #Graph #Future Outlook
