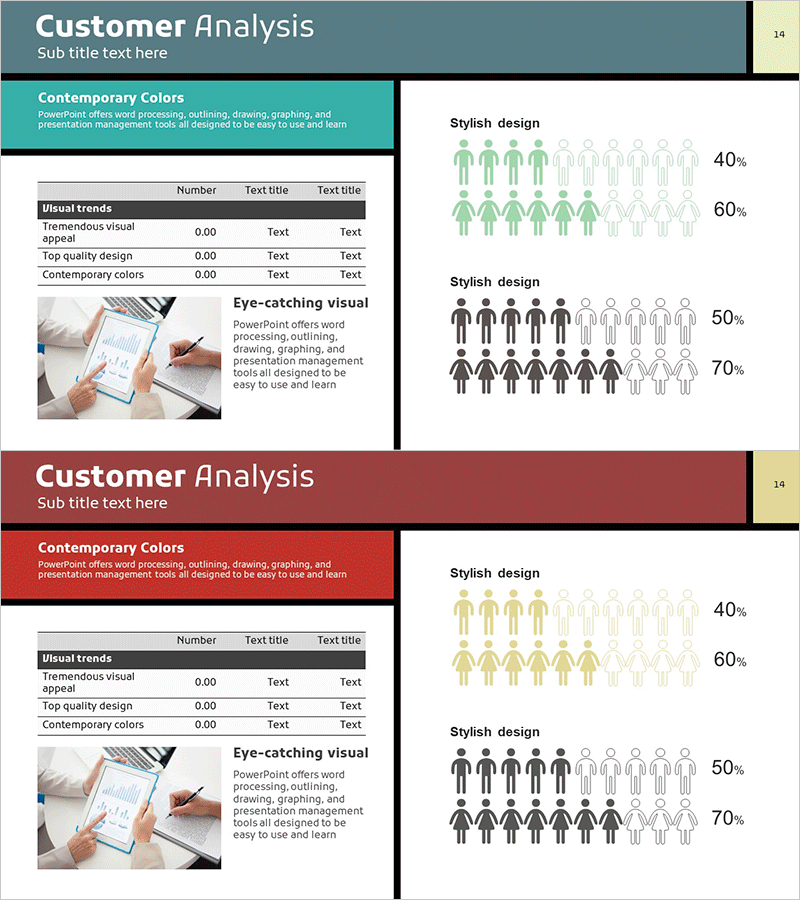
User Gender Ratio Analysis Graph
RM0100007_13
- Last Update 01/26/2025
- File Size 0.7MB
- # of Slides 2
- File Format PPTX
- Slide Ratio 16:9
- Color
Keywords
About the Product
A professional PowerPoint slide designed for customer analysis and market research presentations, visualizing gender ratio data through infographic icons and percentage displays. Available in three color themes—teal, burgundy, and gray—with a two-column layout featuring descriptive text on the left and visual data on the right. The slide uses human icons combined with percentage figures to present demographic breakdowns clearly, making it ideal for customer segmentation, target marketing, and user statistics presentations. Provided as 2 slides in 16:9 widescreen format with fully editable elements for brand customization.
Usage Points
-
Main Usage
Transforms customer demographic data into visual insights by displaying gender ratios through intuitive infographic icons and percentage metrics. Effectively communicates statistical information for decision-making in customer segmentation, target audience analysis, and market research presentations.
-
How to Use
Enter analysis title, description, and key insights in the left text area, then update the percentage figures in the right infographic section with your actual data. Select the color theme that matches your corporate branding and insert into your presentation.
-
Recommended For
Marketing teams presenting customer demographics, sales teams explaining target markets, executive reports on user statistics, market research reports with demographic analysis sections, and business intelligence presentations.
-
Slide Structure
Two-slide set with consistent layout: left side contains text input area for title, description, and analysis content; right side features infographic section with 4-5 human icons and dual-level percentage displays. Header area accommodates slide title with page numbers at the bottom.
Related Products
-

Status Analysis Donut Link Chart – Market and Competitor Analysis
#Company Introduction #Market and Competitor Analysis #Diagram
-

Market Distribution Analysis Positioning Map – Strengthening Competitiveness
#Market and Competitor Analysis #Marketing Plan and Strategy #Diagram
-

A Chart for the Total Population – Effective Market Analysis
#Market and Competitor Analysis #Diagram #Graph
-

Clothing Market Positioning Map – Strategic Analysis
#Market and Competitor Analysis #Marketing Plan and Strategy #Diagram
