A Chart for the Total Population – Effective Market Analysis
RJ0600001_18
- Last Update 06/21/2025
- File Size 0.2MB
- # of Slides 2
- File Format PPTX
- Slide Ratio 16:9
- Color
Keywords
- #Content-Based Slides
- #Design-Based Slides
- #Market and Competitor Analysis
- #Diagram
- #Graph
- #Other
- #Customer Analysis
- #Market Analysis
- #Table
- #16:9
- #population statistics chart PowerPoint
- #demographic analysis slide template
- #pyramid chart data visualization
- #market analysis PowerPoint slide
- #customer segmentation chart PPT
About the Product
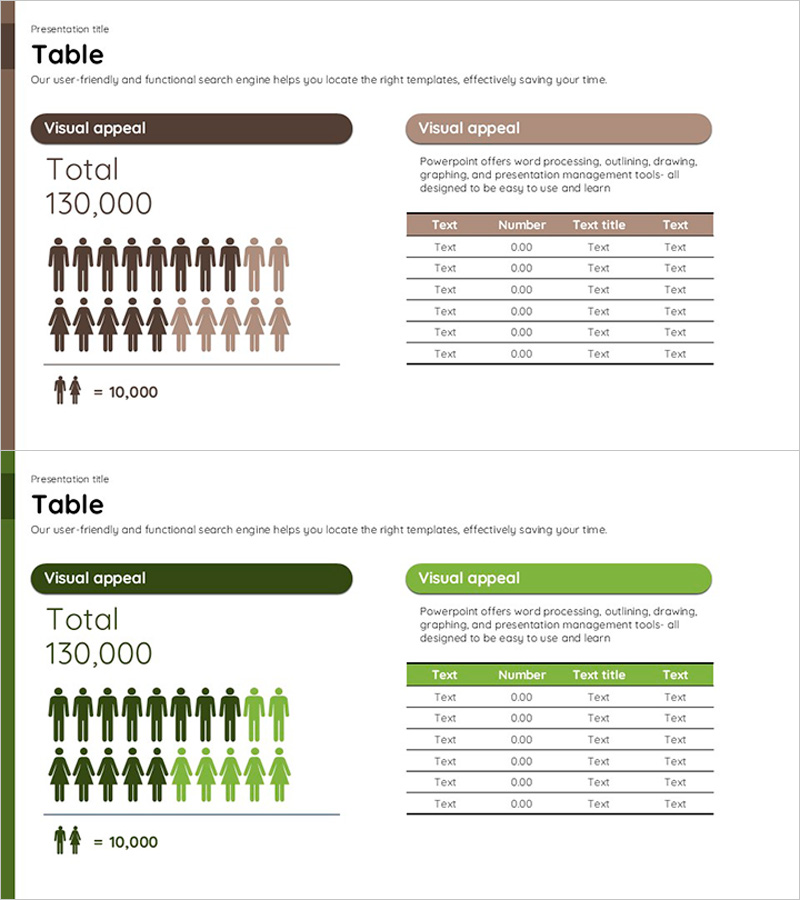
An essential PowerPoint slide for market analysis and customer segmentation featuring a pyramid-shaped population distribution chart paired with a comprehensive data table. The left side displays a hierarchical population breakdown by demographics, while the right side presents detailed statistics in an organized table format. The brown and beige color palette conveys credibility and professionalism, with clearly defined text input areas and data cells ready for immediate customization. This presentation slide is ideal for market research, demographic analysis, target audience identification, and data-driven business decisions in investor pitches and strategic planning documents.
Usage Points
-
Main Usage
Simultaneously display population distribution data through pyramid visualization and numerical tables to enhance analytical credibility. Enable quick identification of demographic patterns by age, gender, and region while providing quantitative evidence for target market definition and market size estimation.
-
How to Use
Input actual population figures into the left pyramid chart and populate the right data table with detailed statistics including regional, age, and gender breakdowns. Use color highlighting to emphasize key target demographics and increase presentation impact during stakeholder meetings.
-
Recommended For
Market analysis sections, customer demographic reports, target market definition in business plans, customer analysis in marketing strategy documents, market overview in investment pitch decks, and population trend analysis presentations. Suitable for government statistics presentations and demographic research reports.
-
Slide Structure
Two-slide layout with the first slide featuring a brown-background pyramid chart showing population distribution across approximately 20 demographic segments, and the second slide presenting a beige-background data table with 6 rows and 4 columns. Each slide includes dedicated title and description areas for contextual explanation and narrative flow.
Related Products
-

Gradient Theme Area Diagram – Market and Competitor Analysis
#Market and Competitor Analysis #Diagram #Graph
-

Customer and Market Analysis Slide – Yellow and Bluegreen Emotion
#Market and Competitor Analysis #Graph #Other
-

Artificial Intelligence Development Market Positioning Map – Effective Visual Data Comparison
#Market and Competitor Analysis #Marketing Plan and Strategy #Diagram
-

Market Distribution Analysis Positioning Map – Strengthening Competitiveness
#Market and Competitor Analysis #Marketing Plan and Strategy #Diagram
