Competitive Market Analysis Graph - Insights for Understanding the Market
RM0100007_10
- Last Update 01/26/2025
- File Size 0.4MB
- # of Slides 2
- File Format PPTX
- Slide Ratio 16:9
- Color
Keywords
- #Content-Based Slides
- #Design-Based Slides
- #Market and Competitor Analysis
- #Diagram
- #Graph
- #Competitor Analysis
- #Market Analysis
- #Table
- #Line
- #Standard Table
- #Line Chart
- #16:9
- #line chart PowerPoint slide
- #market analysis presentation template
- #competitive analysis chart
- #data visualization slides
- #trend analysis PowerPoint download
About the Product
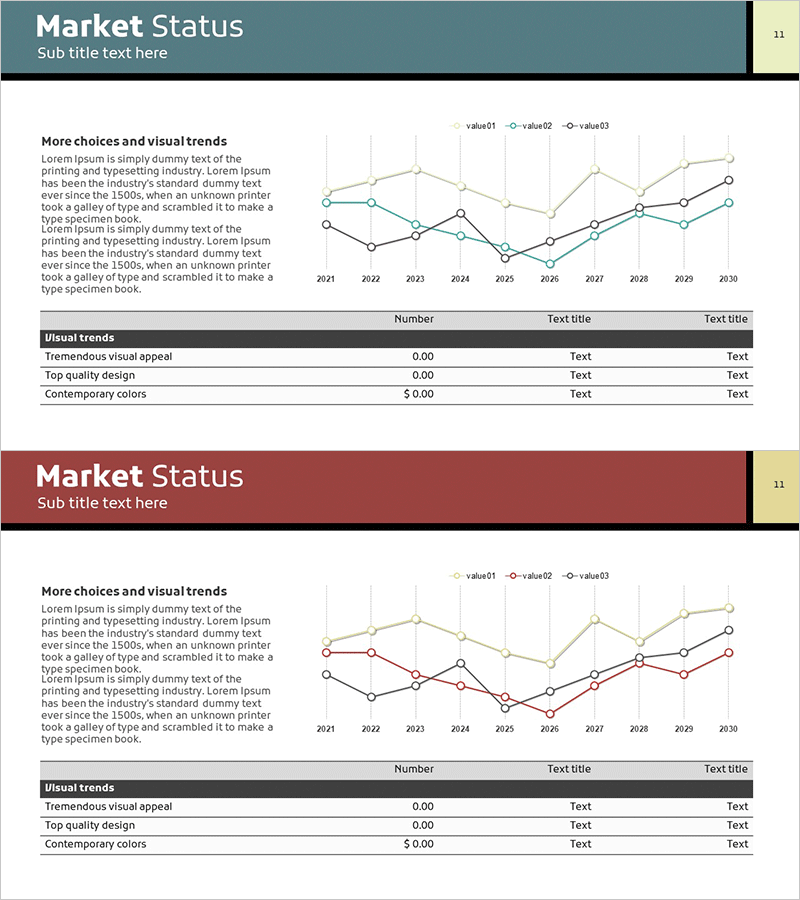
A line chart PowerPoint slide designed for competitive market analysis and trend visualization. This presentation template displays 10-year market changes from 2021 to 2030 across three data series, enabling clear comparison of competitor performance and market insights. The color scheme combines teal, black, and beige tones for a professional business presentation. Each slide includes a multi-line chart with text area for detailed market analysis commentary. The 16:9 widescreen format with 2 slides is fully editable and ready to customize with your own data.
Usage Points
-
Main Usage
Visualize competitive market trends and multi-series data comparisons over time. The three-line structure allows simultaneous analysis of competitor performance, market share evolution, revenue trends, and other complex metrics. Ideal for long-term trend analysis spanning 10 years or more.
-
How to Use
Replace the chart data with your actual market analysis figures. Update the legend labels (value01, value02, value03) with competitor names or market indicators. Add your market insights and analysis findings in the left text area. Customize colors and line styles to match your corporate branding guidelines.
-
Recommended For
Marketing managers, executives, management consultants, and business strategists preparing market analysis reports, competitive intelligence documents, business plans, and investor presentations. Particularly effective for data-driven strategy development and quarterly business reviews.
-
Slide Structure
Each slide features a header section (Market Status title), left text block for analysis narrative, right-aligned multi-line chart (10 data points from 2021-2030, 3 series), and a bottom summary table (3 rows × 3 columns) for key metrics and visual trends.
Related Products
-

Graph Chart for Analysis Comparison – Market and Competitor Analysis
#Market and Competitor Analysis #Diagram #Graph
-

Market Comparison Analysis Broken Line Graph – Competitor Analysis and Visual Impact
#Market and Competitor Analysis #Diagram #Graph
-

Market Trend Analysis Graph – Visualizing Market Status
#Market and Competitor Analysis #Diagram #Graph
-

Black Navy Broken Line Graph Table – Market and Competitor Analysis
#Market and Competitor Analysis #Diagram #Graph
