Positioning Analysis Chart – Market Competitiveness Strategy
RM0100014_25
- Last Update 01/29/2025
- File Size 0.3MB
- # of Slides 2
- File Format PPTX
- Slide Ratio 16:9
- Color
Keywords
- #Content-Based Slides
- #Design-Based Slides
- #Market and Competitor Analysis
- #Marketing Plan and Strategy
- #Diagram
- #Graph
- #Other
- #Market Analysis
- #Positioning
- #Table
- #16:9
- #positioning analysis PowerPoint slide
- #2×2 matrix chart
- #market competitiveness analysis
- #marketing strategy slide
- #competitor analysis PPT
About the Product
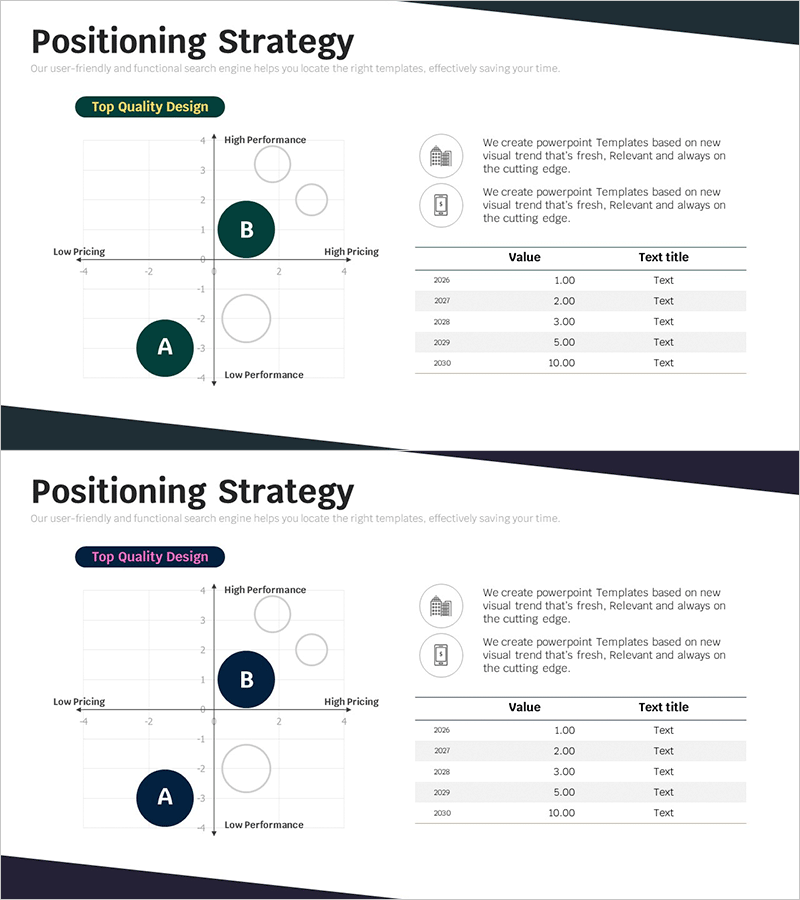
A positioning strategy PowerPoint slide that analyzes market competitiveness using a 2×2 matrix framework. The horizontal axis represents low to high pricing, while the vertical axis spans low to high performance, enabling visual comparison of competitor positions. Dark teal background with circular bubble charts and a data table on the right side support both quantitative analysis and strategic interpretation. This presentation slide effectively communicates market positioning across marketing planning, strategy development, and investment pitches.
Usage Points
-
Main Usage
Visualize your company and competitors' market positioning using a 2×2 matrix to establish competitive strategy foundations. Identify competitor positions based on pricing and performance levels to develop differentiation strategies.
-
How to Use
Plot competitors as bubbles on the left matrix by size and position, then populate the right data table with annual pricing and performance metrics. Use during presentations as supporting evidence when explaining your positioning strategy and competitive advantages.
-
Recommended For
Marketing managers, strategy planning teams, and executive presentations. Ideal for new product launch strategies, market entry planning, and competitive analysis sections to support decision-making.
-
Slide Structure
Two-slide set: First slide features dark teal background with 2×2 matrix chart, three bubbles, two icons on the right with text areas. Second slide uses dark navy background with identical layout. Each slide includes left-side matrix and right-side data table (5 rows × 3 columns).
Related Products
-

Clothing Market Positioning Map – Strategic Analysis
#Market and Competitor Analysis #Marketing Plan and Strategy #Diagram
-

Competitor Positioning Graph – Diagram for Market Analysis
#Market and Competitor Analysis #Marketing Plan and Strategy #Diagram
-

Artificial Intelligence Development Market Positioning Map – Effective Visual Data Comparison
#Market and Competitor Analysis #Marketing Plan and Strategy #Diagram
-

Business Market Positioning Strategy Slide – Competitive Analysis
#Market and Competitor Analysis #Marketing Plan and Strategy #Diagram
