Competitor Analysis Area Graph – Visualizing Market Status
RM0100006_10
- Last Update 01/26/2025
- File Size 0.3MB
- # of Slides 2
- File Format PPTX
- Slide Ratio 16:9
- Color
Keywords
- #Content-Based Slides
- #Design-Based Slides
- #Market and Competitor Analysis
- #Graph
- #Market Analysis
- #Competitive Advantage
- #Horizontal Bar
- #Horizontal Bar Chart
- #16:9
- #area chart PowerPoint
- #market status slide
- #competitor analysis presentation
- #data comparison chart
- #how to create area chart in PowerPoint
About the Product
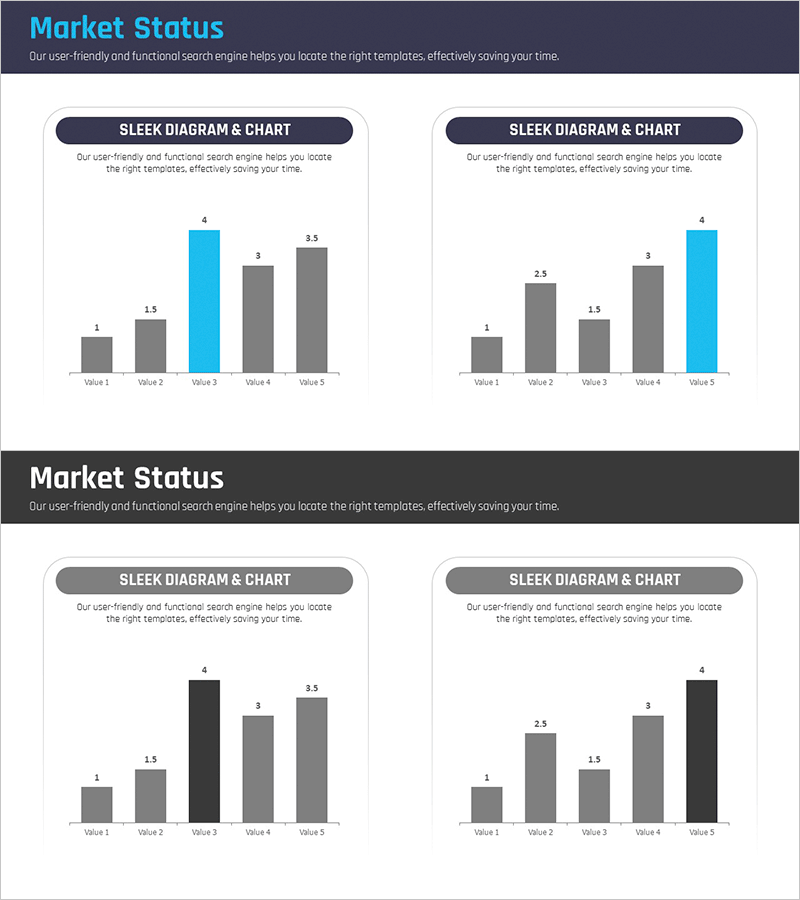
An area chart PowerPoint slide designed to visualize competitor analysis and market status across five data categories. The slide effectively displays comparative data over time or by category, with gray and cyan color contrast highlighting key metrics. Numerical labels are clearly marked for precise data communication. The 2-slide set includes two layout variations of the same design, allowing you to present multiple datasets in a consistent visual style. Ready to use in business presentations, market reports, strategy decks, and marketing plans with immediate editing capability.
Usage Points
-
Main Usage
Visualize five-category data using area charts to enable simultaneous comparison of individual items and overall composition. Clear numerical labels ensure accurate data representation for market analysis, competitive positioning, and performance trends.
-
How to Use
Insert into market analysis sections of business presentations, competitive landscape pages in executive reports, or research findings in marketing strategy documents. Data-driven design allows quick scenario comparisons by updating values while maintaining consistent formatting.
-
Recommended For
Marketing managers, executives, business strategists, and consultants requiring data-driven decision-making. Ideal for quarterly performance reviews, market entry strategy development, competitive advantage analysis, and investor presentations.
-
Slide Structure
Two area chart layouts displaying five data points (Value 1 through Value 5). First layout emphasizes Value 3 in cyan; second emphasizes Value 5. Each value is labeled with numerical data (1, 1.5, 2.5, 3, 3.5, etc.) for clear interpretation.
Related Products
-

Bar Chart for Vegetable Intake Survey
#Market and Competitor Analysis #Graph #Market Analysis
-

Scientific Research Results Graph – A Tool for Market Analysis and Competitive Advantage
#Market and Competitor Analysis #Graph #Market Analysis
-

Illustration Brush Graph Analysis Slide
#Market and Competitor Analysis #Graph #Market Analysis
-

Fire Dispatch Graph – Market Analysis and Competitive Advantage
#Market and Competitor Analysis #Graph #Market Analysis
