Bar Chart for Vegetable Intake Survey
RJ0600069_9
- Last Update 07/08/2025
- File Size 4.6MB
- # of Slides 2
- File Format PPTX
- Slide Ratio 16:9
- Color
Keywords
- #Content-Based Slides
- #Design-Based Slides
- #Market and Competitor Analysis
- #Graph
- #Market Analysis
- #Competitive Advantage
- #Horizontal Bar
- #Horizontal Bar Chart
- #16:9
- #horizontal bar chart PowerPoint
- #bar graph presentation slide
- #data comparison template
- #market analysis chart
- #vegetable intake survey template
About the Product
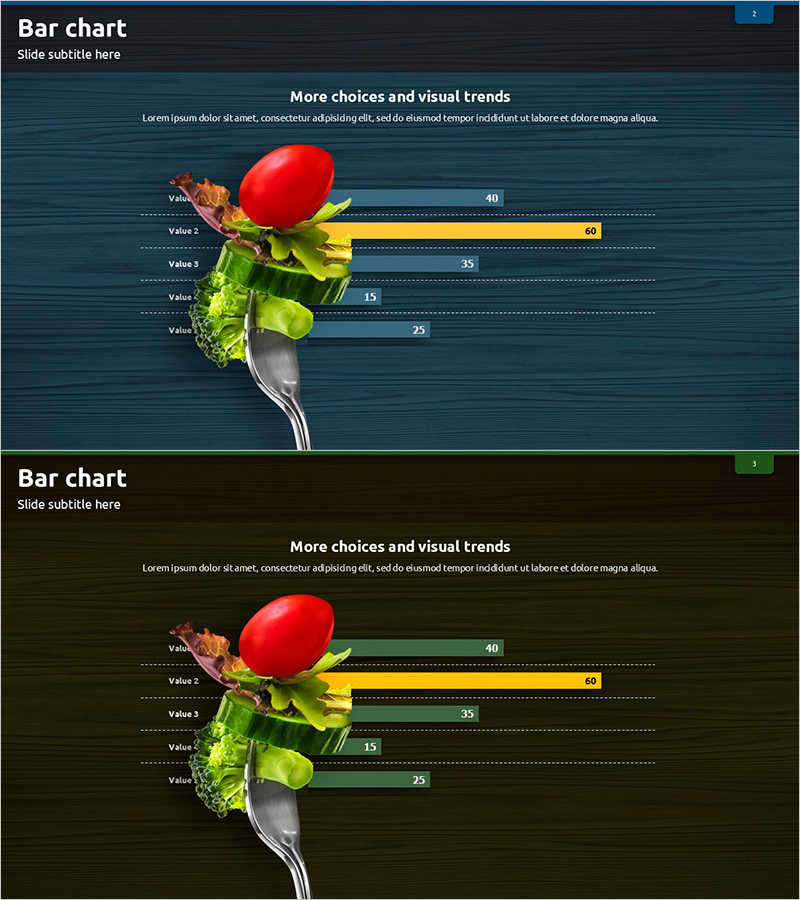
A horizontal bar chart PowerPoint slide designed for vegetable intake surveys and market analysis presentations. Set against a dark blue background, five data items are visualized using yellow, orange, and blue bars, complemented by fork and fresh vegetable imagery that perfectly suits food, nutrition, and agricultural industry presentations. The 2-slide set provides identical layouts with design variations, making it ideal for comparative analysis and diverse dataset representations. Delivered in 16:9 widescreen PPTX format, all values, labels, and colors are fully editable for immediate customization.
Usage Points
-
Main Usage
Expresses numerical comparison and ranking of five items using horizontal bars, enabling intuitive understanding of relative data magnitudes. Ideal for vegetable consumption analysis, market share comparison, and competitive benchmarking slides, while fork and fresh vegetable visuals add contextual relevance to food, nutrition, and agricultural industry presentations.
-
How to Use
Modify bar lengths and numerical labels in the slide master to match your dataset, then replace item names (Value 1–5) with actual category names. The 2-slide set shares identical structure, allowing you to arrange them sequentially for comparative analysis, time-series trends, or to display current status on one slide and target metrics on the other.
-
Recommended For
Marketing professionals in food and beverage industries, market research report authors, nutrition and food science educators, consumer survey presenters, and executives preparing data-driven decision-making materials will find this template particularly valuable for stakeholder communications.
-
Slide Structure
Both slides feature identical layouts with title and subtitle areas at the top, five horizontal bars (Value 1–5 with values 40, 60, 35, 15, 25) in the center, and fork, tomato, lettuce, broccoli, and cucumber imagery on the left. Bars use three distinct colors (yellow, orange, blue), with dotted gridlines and numerical labels supporting accurate value interpretation.
Related Products
-

Illustration Brush Graph Analysis Slide
#Market and Competitor Analysis #Graph #Market Analysis
-

Fire Dispatch Graph – Market Analysis and Competitive Advantage
#Market and Competitor Analysis #Graph #Market Analysis
-

Scientific Research Results Graph – A Tool for Market Analysis and Competitive Advantage
#Market and Competitor Analysis #Graph #Market Analysis
-

Competitor Analysis Area Graph – Visualizing Market Status
#Market and Competitor Analysis #Graph #Market Analysis
