Illustration Brush Graph Analysis Slide
RJ0900021_19
- Last Update 08/22/2025
- File Size 0.1MB
- # of Slides 2
- File Format PPTX
- Slide Ratio 16:9
- Color
Keywords
- #Content-Based Slides
- #Design-Based Slides
- #Market and Competitor Analysis
- #Graph
- #Market Analysis
- #Competitive Advantage
- #Horizontal Bar
- #Horizontal Bar Chart
- #16:9
- #horizontal bar chart PowerPoint
- #bar graph slide template
- #data comparison chart
- #market analysis graph
- #how to create bar chart in PowerPoint
About the Product
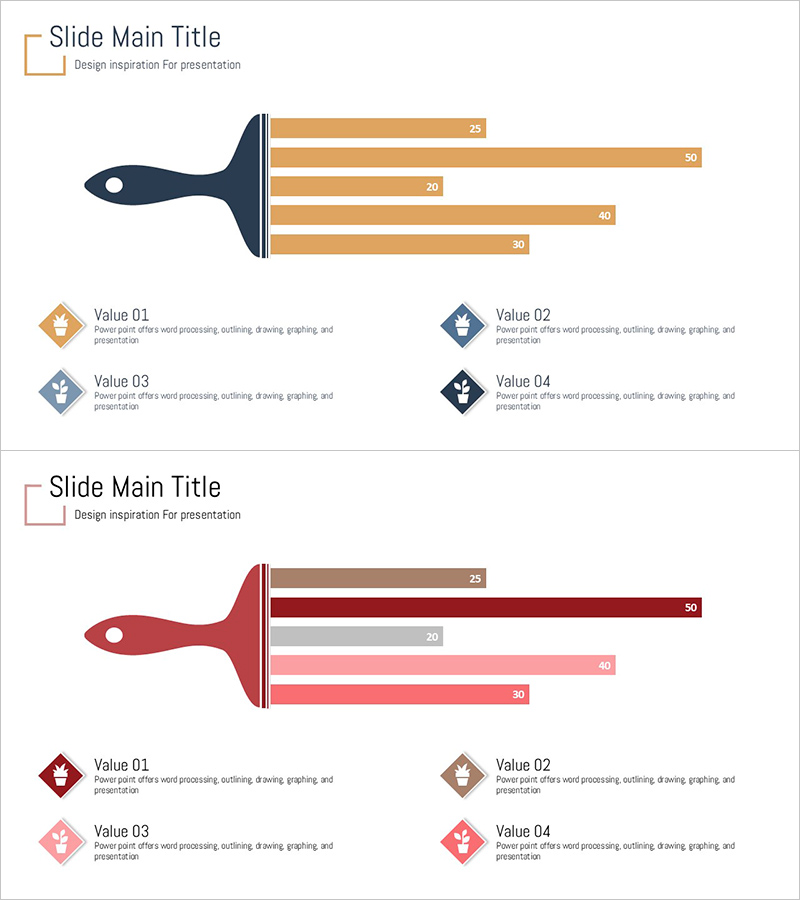
A horizontal bar chart PowerPoint slide featuring an illustration brush design style. This 2-slide set is optimized for visualizing quantitative data such as competitor comparison, market share, and performance analysis. The warm color palette of orange and red tones adds vibrancy to your presentation, while numerical values displayed beside each bar ensure clear information delivery. Supports comparison of up to 5 items with text and icon customization options. Ready to use in business reports, sales presentations, marketing proposals, and investment pitch decks.
Usage Points
-
Main Usage
Visualize quantitative data for competitor comparison, market share analysis, sales performance, and key metrics across up to 5 items. The horizontal bar length intuitively represents numerical differences, while displayed values provide precise data points for audience understanding.
-
How to Use
Apply to business report performance sections, marketing proposal competitive advantage analysis, investment pitch deck market overview, and proposal solution comparison slides. Easily customize text and icons to match your specific data and branding requirements.
-
Recommended For
Planners, marketing managers, sales teams, executive report presenters, and consultants who need to persuade audiences with quantitative data. Ideal for market analysis, competitive analysis, and performance reporting presentations across all business contexts.
-
Slide Structure
2-slide layout with 5-item horizontal bar charts on each slide. Features warm orange and red bar colors paired with dark navy illustration brush-style icons. Numerical values are positioned to the right of each bar. Includes legend area and descriptive text sections for context and explanation.
Related Products
-

Fire Dispatch Graph – Market Analysis and Competitive Advantage
#Market and Competitor Analysis #Graph #Market Analysis
-

Scientific Research Results Graph – A Tool for Market Analysis and Competitive Advantage
#Market and Competitor Analysis #Graph #Market Analysis
-

Bar Chart for Vegetable Intake Survey
#Market and Competitor Analysis #Graph #Market Analysis
-

Competitor Analysis Area Graph – Visualizing Market Status
#Market and Competitor Analysis #Graph #Market Analysis
