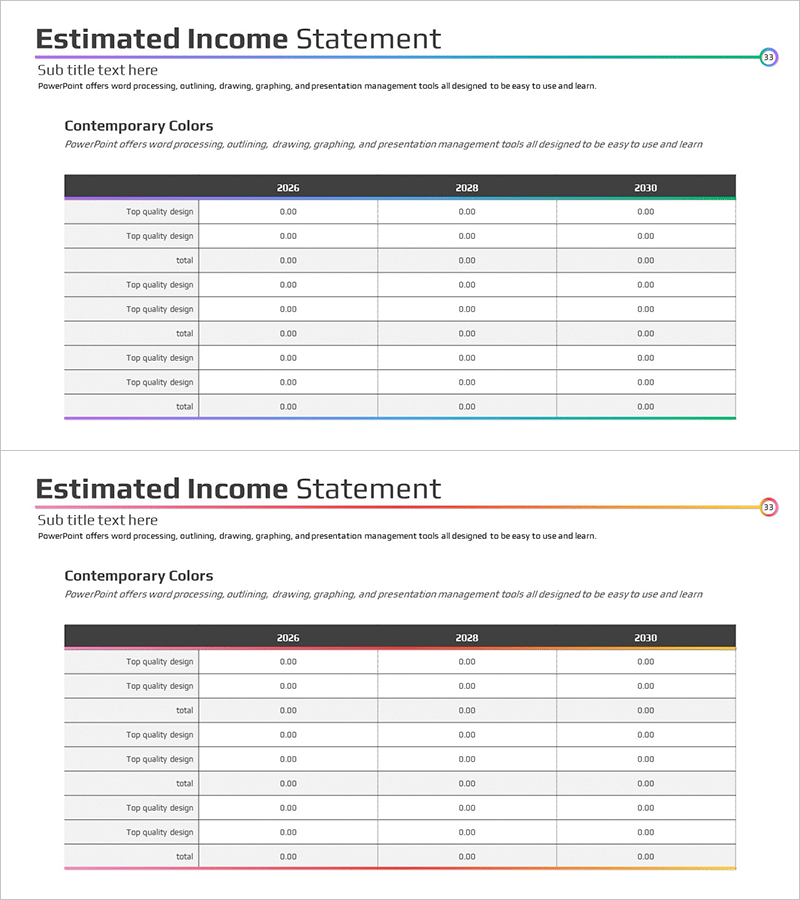
Gradient Key Financial Indicators – Clear Performance Visualization
RM0100005_32
- Last Update 01/26/2025
- File Size 0.3MB
- # of Slides 2
- File Format PPTX
- Slide Ratio 16:9
- Color
Keywords
About the Product
A 2-slide PowerPoint presentation designed to visualize financial performance with clarity and impact. Features a gradient-colored 3-column table layout that enables year-over-year and item-by-item financial metric comparison at a glance. The dark header and white data cells create strong contrast for optimal numerical readability, while the subtitle area accommodates section descriptions. Optimized for financial data representation including income statements, balance sheets, and budget summaries, this slide deck is ready for immediate use in investor presentations and executive reports.
Usage Points
-
Main Usage
Enables clear year-over-year and category-by-category comparison of financial metrics. Gradient color treatment visually distinguishes data hierarchy, while dark header and white cells maximize numerical readability. Specialized for quantitative data representation including income statements, balance sheets, budget status, and financial ratio analysis.
-
How to Use
Use in investor briefings, executive reports, and financial analysis presentations. Enter section name in the subtitle area (e.g., 2026–2030 Financial Outlook), then input actual financial figures into table cells. Maintain gradient colors while replacing data only to preserve consistent brand imagery across presentations.
-
Recommended For
CFOs, finance managers, and IR teams presenting financial performance to investors, shareholders, and executives. Suitable for startup pitch decks, corporate business plans, financial analysis reports, and budget allocation presentations. Essential for presentations supporting data-driven decision-making.
-
Slide Structure
Two-slide layout with title and subtitle area at top, followed by 3-column table section. Table features dark header row for item labels and three year columns for data entry. Gradient background allows adjustment of data emphasis to highlight key financial indicators and trends.
Related Products
-

Business Profit Analysis Table – Financial Performance and Strategy Analysis
#Financial Plans and Performance #Diagram #Sales and Revenue
-

Farm Key Financial Indicators Table Chart – Intuitive Presentation of Financial Performance
#Financial Plans and Performance #Diagram #Sales and Revenue
-

Table Chart and Descriptive Text – Visualizing Sales Metrics
#Financial Plans and Performance #Diagram #Sales and Revenue
-

Key Financial Indicators Analysis Diagram – Efficient Financial Planning
#Financial Plans and Performance #Diagram #Sales and Revenue
