Step-by-step Strategy STEP 5 Diagram – Flow for Business Management
RM0100005_28
- Last Update 01/26/2025
- File Size 0.4MB
- # of Slides 2
- File Format PPTX
- Slide Ratio 16:9
- Color
Keywords
- #Content-Based Slides
- #Design-Based Slides
- #Business Management
- #Marketing Plan and Strategy
- #Diagram
- #Implementation Plan
- #Pricing Strategy
- #Flow
- #Table
- #Circular Flow
- #16:9
- #5-step circular diagram PowerPoint
- #circular flow diagram slide
- #business strategy diagram
- #step-by-step process PowerPoint
- #marketing planning diagram
About the Product
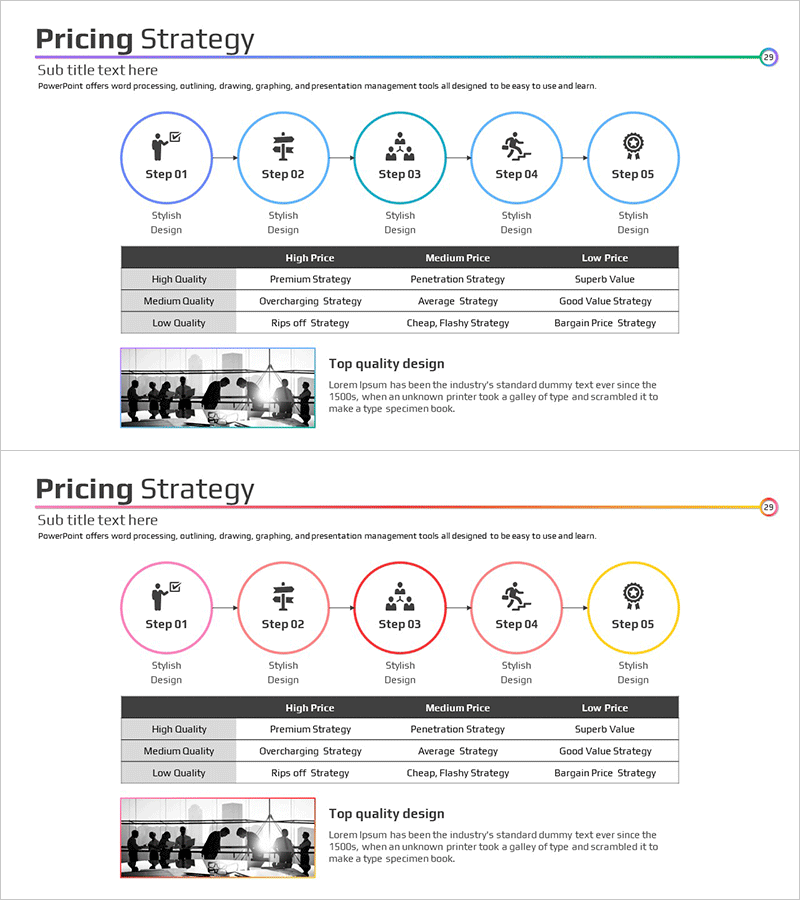
A 5-step circular diagram PowerPoint slide designed for business management and marketing planning. Five nodes connected in a circular flow clearly express sequential processes and cycles, with icons and text areas at each stage to intuitively convey strategic progression. The shape-based design is fully editable in PowerPoint for immediate use in presentations and planning documents. This 2-slide set offers multiple color variations and is optimized for 16:9 widescreen format.
Usage Points
-
Main Usage
Visualizes business management processes, marketing strategy cycles, product development stages, and organizational workflow. The 5-node circular structure effectively represents continuous improvement and feedback loops, making it ideal for executive reports and strategic presentations.
-
How to Use
Enter stage names and descriptions in each node's text area and replace icons to create customized diagrams. Select color-variant slides matching your presentation theme and topic tone, and use arrows between nodes to emphasize flow direction.
-
Recommended For
Executives, strategy planners, marketing professionals, and project managers can use this in business plans, strategy reports, and marketing proposals. Suitable for organizational process improvement, new business initiatives, customer journey mapping, and various strategic contexts.
-
Slide Structure
2-slide set featuring 5 nodes connected in a circular diagram. Each node includes an icon area and text input field, with space for a title or key message in the center. First slide uses blue tones; second slide features red tones for color variation.
Related Products
-

Calendar Illustration Table – Visualizing Business Strategy
#Business Strategy #Business Management #Diagram
-

Smart Meeting Strategies for High Performance – Effective Progress Flow
#Business Management #Diagram #Execution Plan
-

Detailed Plan Summary Table for Business Strategy
#Business Strategy #Business Management #Diagram
-

Presentation Calendar – Two Versions
#Business Management #Operational Plan #Diagram
