Stylish Data Visualization Slide – Insights for CEO Presentation
RJ0300080_4
- Last Update 05/11/2025
- File Size 1.3MB
- # of Slides 2
- File Format PPTX
- Slide Ratio 16:9
- Color
Keywords
- #Content-Based Slides
- #Design-Based Slides
- #Company Introduction
- #Market and Competitor Analysis
- #Diagram
- #Graph
- #Introduction of Executives
- #Customer Analysis
- #Table
- #Circles
- #Standard Table
- #Doughnut Chart
- #16:9
- #donut chart PowerPoint slide
- #pie chart presentation template
- #KPI dashboard PPT
- #data visualization slides
- #executive performance report
About the Product
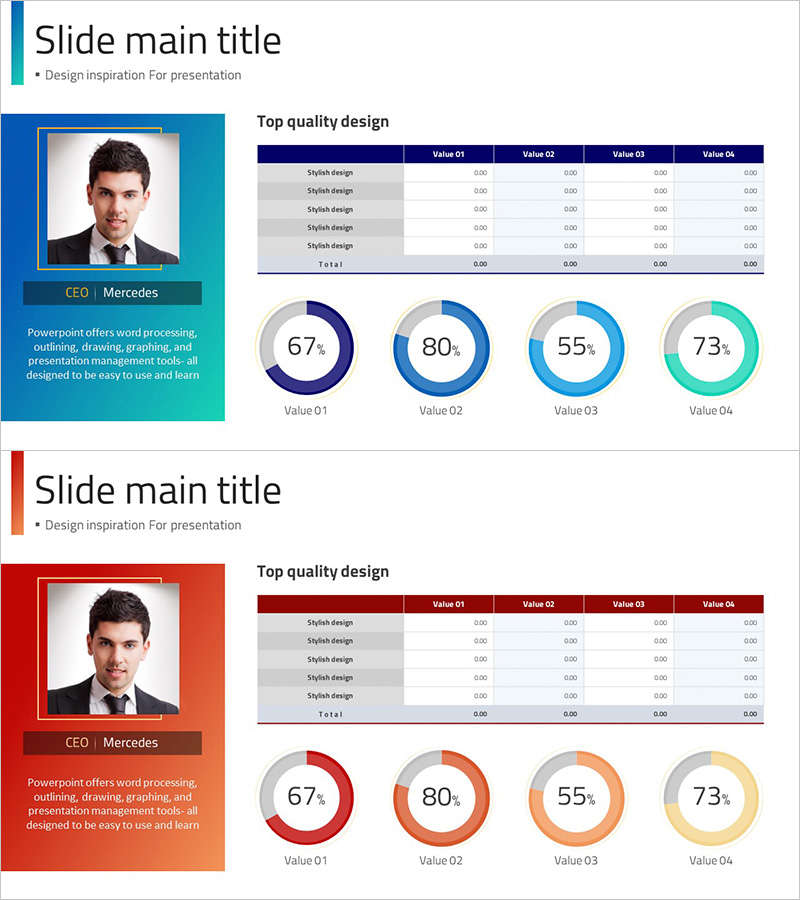
A professional data visualization PowerPoint slide designed for executive presentations and performance reporting. This template features four donut-shaped pie charts arranged in a 2×2 grid layout, each displaying key performance indicators (KPI) with percentage values. The slide includes a data summary table with five rows and four columns, complementing the visual charts. Color-coded donut segments in blue, red, orange, and teal gradients make it easy to compare metrics at a glance. Perfect for quarterly business reviews, investor presentations, and strategic planning meetings where data-driven insights need clear visual communication.
Usage Points
-
Main Usage
Ideal for presenting quarterly earnings, performance metrics, market analysis, and strategic KPIs in executive boardrooms and investor meetings. The four donut charts enable side-by-side comparison of revenue, profit margin, customer satisfaction, and market share—allowing stakeholders to quickly assess goal achievement and business health.
-
How to Use
Replace the sample percentages (67%, 80%, 55%, 73%) with your actual data values. Update the table rows with metric names and corresponding figures. Customize colors to match your corporate branding guidelines. The 16:9 widescreen format is optimized for modern projection systems and large display screens.
-
Recommended For
CFOs, C-suite executives, business unit leaders, and strategy teams presenting to boards of directors, shareholders, and senior management. Also suitable for consulting firms, financial institutions, and enterprise organizations conducting performance analysis and competitive benchmarking.
-
Slide Structure
Slide 1: Executive profile photo with company name, role label, and descriptive text, plus a 5-row × 4-column data table with header row. Slide 2: Four donut-shaped pie charts (Value 01–04) arranged in 2×2 grid formation with percentage displays. Color scheme: blue, red, orange, and teal gradient segments throughout.
Related Products
-

Separate Recycling Implementation Rate Survey Donut Chart – Visualized in Blue and Green
#Market and Competitor Analysis #Graph #Customer Analysis
-

Table Charts for Exercise – Market Analysis and Performance
#Market and Competitor Analysis #Financial Plans and Performance #Diagram
-

Causes of Stress for Office Workers – Visualized Donut Chart
#Market and Competitor Analysis #Graph #Customer Analysis
-

Blue Green Donut Chart Analysis – Visualization of Customer Success Stories
#Market and Competitor Analysis #Customer Success Stories #Graph
