Visually Appealing Infographic Slide – Interesting Design
RB0800028-1_9
- Last Update 03/24/2025
- File Size 0.2MB
- # of Slides 2
- File Format PPTX
- Slide Ratio 4:3
- Color
Keywords
About the Product
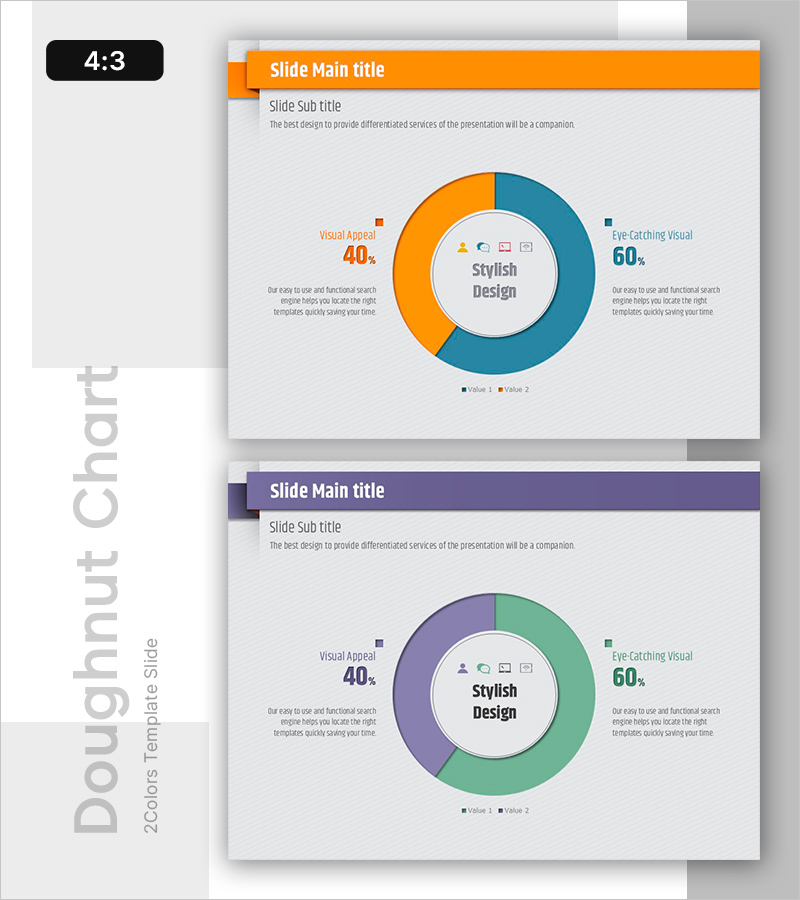
A PowerPoint slide featuring a central circular message area flanked by two doughnut-shaped charts for displaying dual data comparisons. The design uses contrasting orange and teal color palettes to enhance visual distinction, with percentage values and descriptive labels positioned alongside each chart segment. The 2-slide set is ready for immediate use in presentations requiring ratio-based data visualization and comparative analysis.
Usage Points
-
Main Usage
Optimized for comparing two key metrics or categories side-by-side using doughnut-shaped charts. The central message zone emphasizes the overall theme while the flanking charts display detailed percentage breakdowns. Ideal for marketing performance analysis, customer satisfaction metrics, market share distribution, budget allocation, and competitive positioning.
-
How to Use
Replace the center 'Stylish Design' text with your main topic. Input first dataset values into the left doughnut chart (e.g., Visual Appeal 40%) and second dataset into the right chart (e.g., Eye-Catching Visual 60%). Update the legend labels and percentage figures to match your actual data, then insert into your presentation.
-
Recommended For
Marketing and sales teams presenting performance metrics, executive reports, business proposals, market research findings, customer satisfaction surveys, budget status updates, and product positioning analyses. Particularly effective when emphasizing two contrasting perspectives simultaneously.
-
Slide Structure
Two-slide layout with the first slide featuring an orange-accented doughnut chart (40% vs 60%) and the second displaying purple-green doughnut segments (30% vs 60%). Each slide includes a central circular message zone, left-side label with percentage, right-side label with percentage, and bottom legend. Formatted in 4:3 aspect ratio for standard presentations.
Related Products
-

Children's Competency Analysis Chart – Competitive Market Analysis
#Market and Competitor Analysis #Graph #Customer Analysis
-

Customer Analysis and Market Share Graph – Harmony of Blue and Red
#Market and Competitor Analysis #Graph #Other
-

Causes of Stress for Office Workers – Visualized Donut Chart
#Market and Competitor Analysis #Graph #Customer Analysis
-

Consumer Analysis Chart by Age Group – Market Share and Customer Analysis
#Market and Competitor Analysis #Graph #Customer Analysis
