Farm Bar Graph for Market Analysis – Formulating Effective Business Strategies
RJ0600019_7
- Last Update 06/26/2025
- File Size 0.3MB
- # of Slides 2
- File Format PPTX
- Slide Ratio 16:9
- Color
Keywords
- #Content-Based Slides
- #Design-Based Slides
- #Business Strategy
- #Market and Competitor Analysis
- #Graph
- #Achievements
- #Market Status
- #Horizontal Bar
- #Horizontal Bar Chart
- #16:9
- #horizontal bar chart PowerPoint
- #bar graph slide template
- #market analysis chart
- #business strategy data visualization
- #8-item comparison slide
About the Product
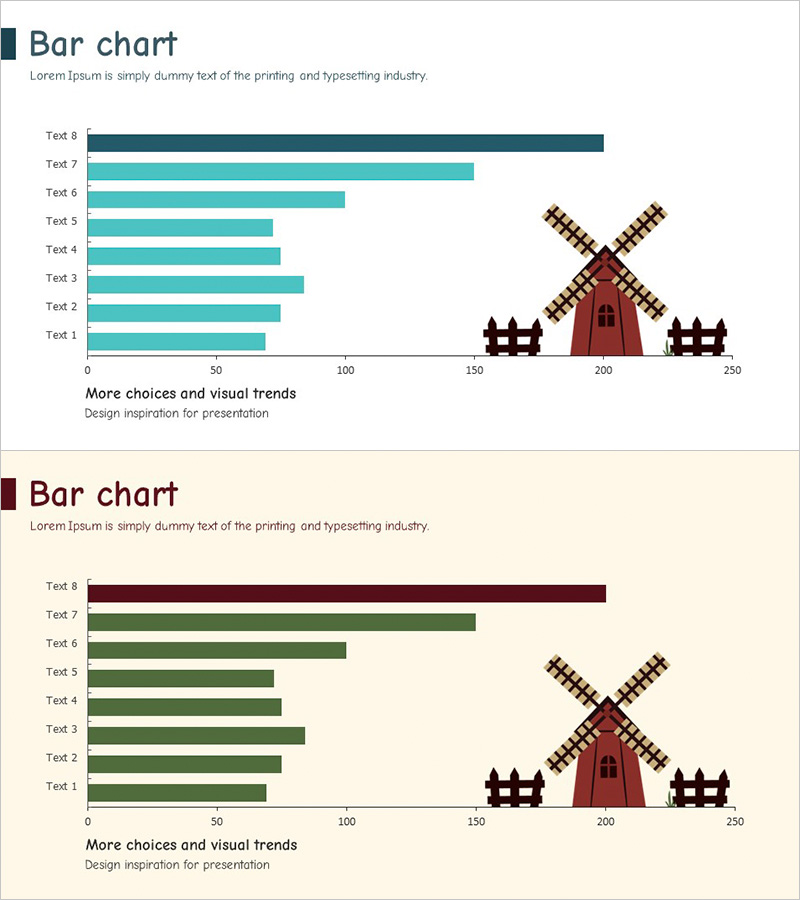
A horizontal bar chart PowerPoint slide designed for market analysis and business strategy development. This presentation template features 8 items displayed as horizontal bars for easy comparison, available in two color schemes: teal and wine. Each slide is optimized for agricultural and farm data visualization, enabling immediate use in performance analysis and market assessment presentations. The 16:9 widescreen format includes 2 slides that can be directly inserted into your presentation deck.
Usage Points
-
Main Usage
Compare 8 data points side-by-side using horizontal bars for market analysis, competitive benchmarking, sales performance tracking, and KPI assessment. Specialized for agricultural and farm-related data visualization, supporting decision-making during business strategy planning phases.
-
How to Use
Input your actual data into the bar chart, and the bar lengths adjust automatically. Modify text labels to change item names and adjust colors to match your brand guidelines. The teal version emphasizes reliability and stability, while the wine version conveys professionalism and thoughtfulness.
-
Recommended For
Agricultural executives, marketing managers, business planning teams, investment pitch presenters, and market research analysts. Ideal for quarterly performance reports, market situation analysis, executive briefings, business plan presentations, and strategic planning documents.
-
Slide Structure
Two-slide layout with identical data structure but different color schemes. The first slide features teal-colored horizontal bars, while the second uses wine-colored bars. Each bar represents one of 8 items on a 0-250 scale axis. Legend and title areas are positioned separately for clear data presentation.
Related Products
-

Sports Analysis Bar Chart – Easy Performance Monitoring Option
#Business Strategy #Market and Competitor Analysis #Graph
-

Eco-friendly Horizontal Bar Graph for Market Overview
#Market and Competitor Analysis #Graph #Market Status
-

Donut Chart for Adventure Supplies – Business Strategy
#Business Strategy #Market and Competitor Analysis #Graph
-

Test Tube Bar Graph for Market Analysis – Highlighting Competitive Advantage
#Market and Competitor Analysis #Graph #Market Status
