Dark AI vs VC Comparison Table Slide – Case Study PowerPoint
RM0500013_15
- Last Update 04/24/2026
- File Size 14.5MB
- # of Slides 2
- File Format PPTX
- Slide Ratio 16:9
- Color
Keywords
- #Design-Based Slides
- #Market and Competitor Analysis
- #Diagram
- #Market Status
- #Competitive Advantage
- #Table
- #Standard Table
- #16:9
- #AI vs traditional VC comparison PowerPoint slide
- #competitive advantage table presentation template
- #dark comparison table slide deck
- #AI investment platform competitive slide
- #VC pitch deck comparison table PowerPoint
- #investment performance comparison case study slide
About the Product
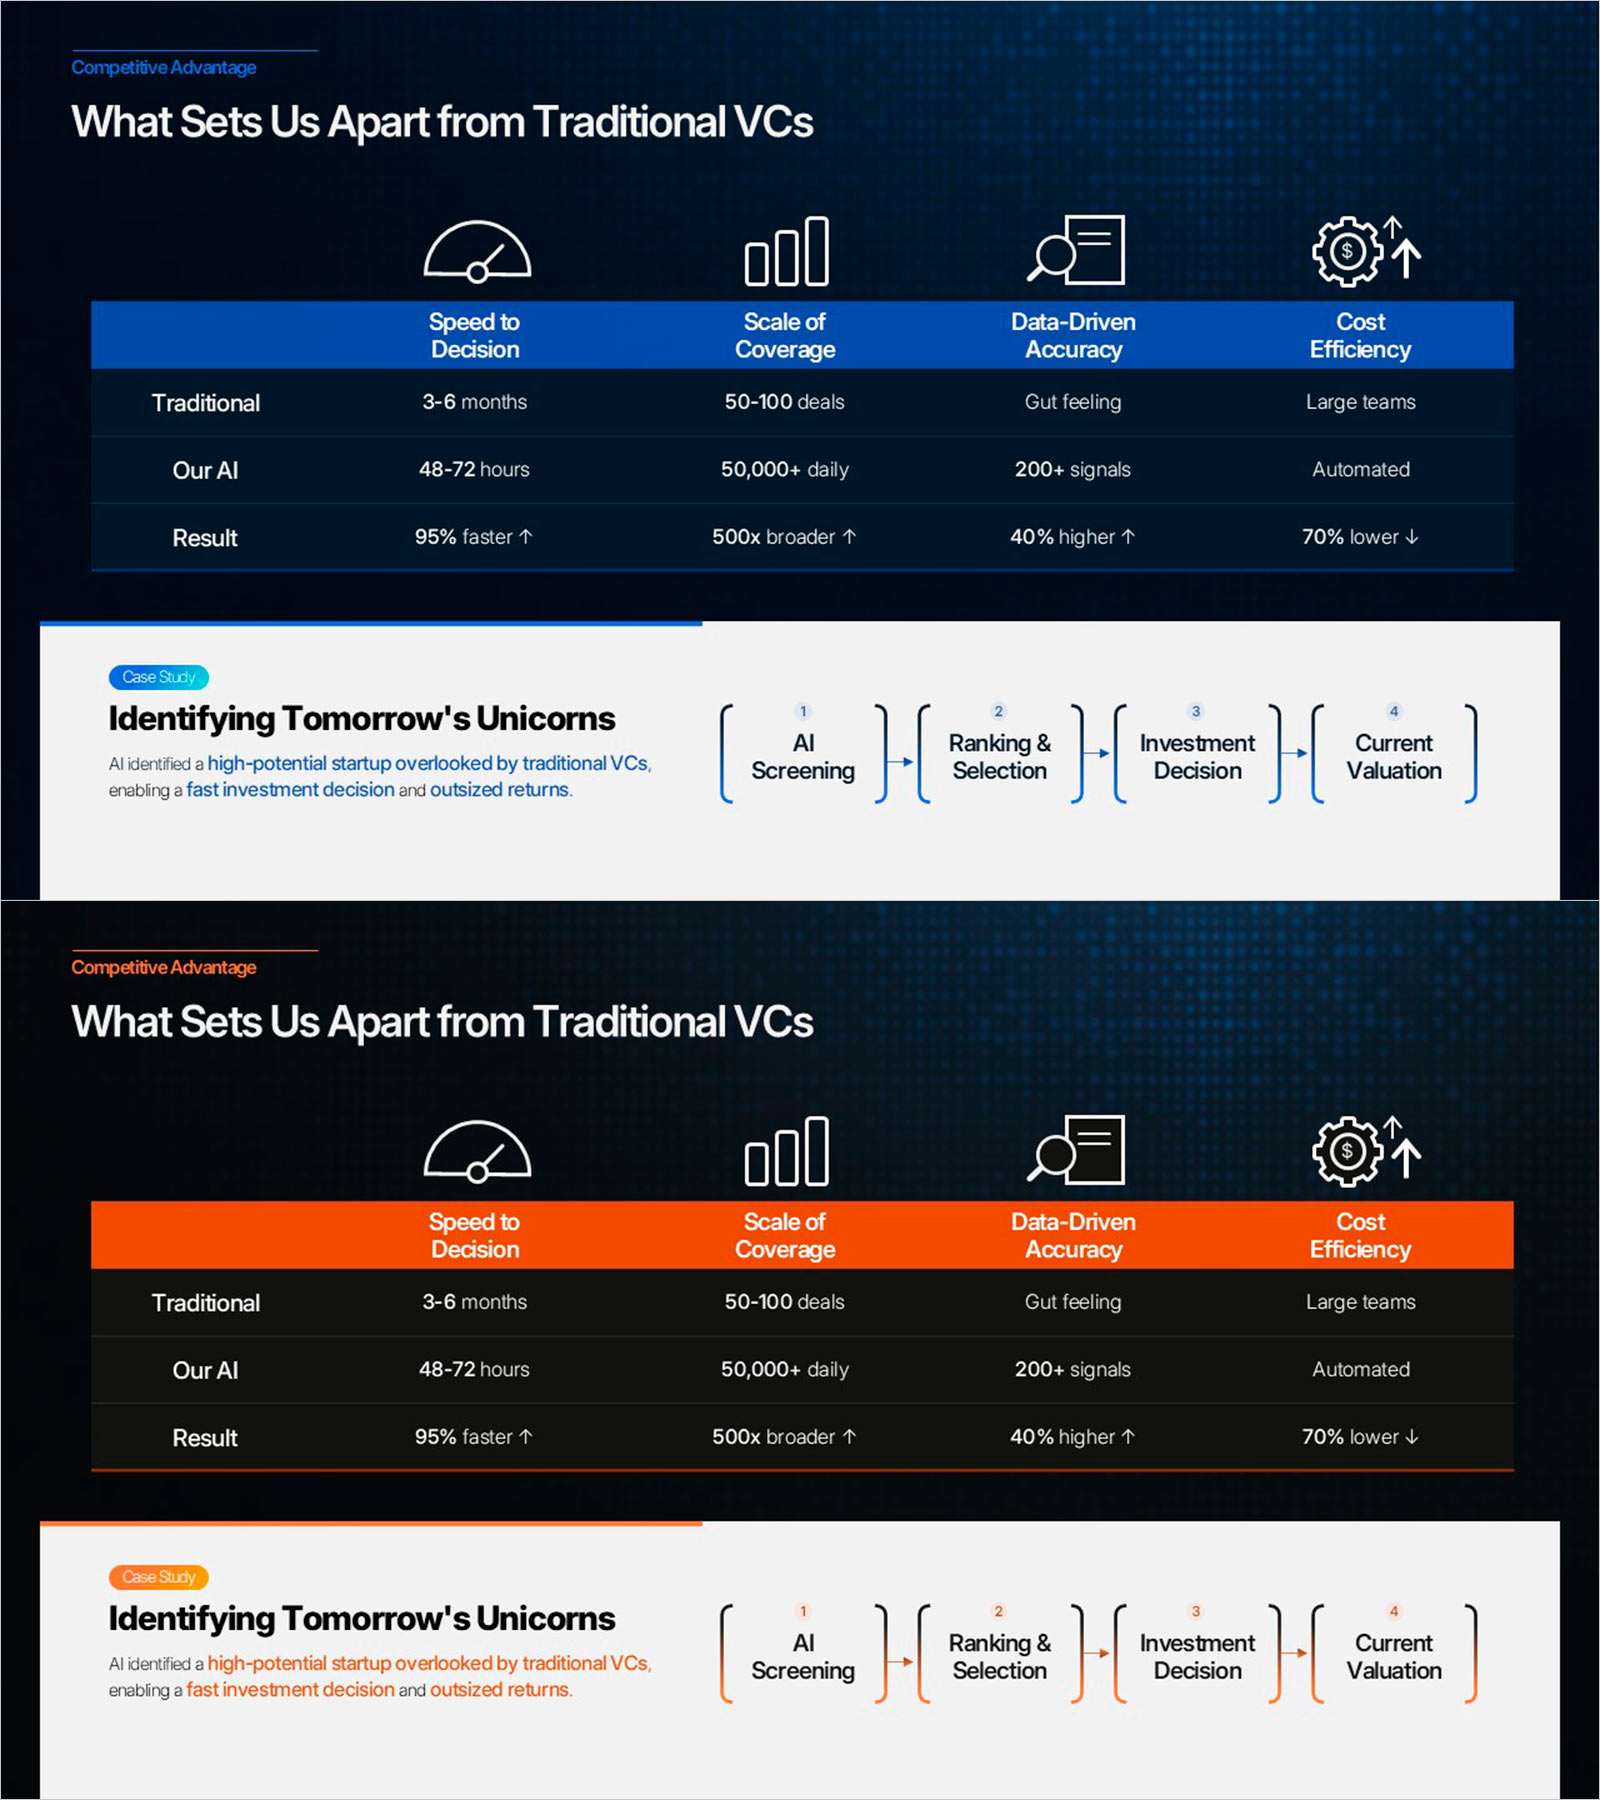
This dark PowerPoint slide presents AI investment advantages over traditional VCs through a four-column comparison table and a case study panel. Three rows — Traditional, Our AI, and Result — show 95% faster decisions, 500x broader coverage, 40% more accurate signals, and 70% lower costs. A 'Case Study' panel below includes a four-step process flow ending with Current Valuation. Both navy-blue and orange-amber variants are included. Swap figures and labels in PowerPoint for VC pitch decks and competitive positioning slides.
Usage Points
-
Main Usage
Compare AI investment platform advantages against traditional VCs — a four-column table with concrete result metrics plus a case study flow — in one slide for investor pitches.
-
How to Use
Replace each column header, row labels, and metric values in the table, then update the case study title and four-step flow. Choose navy-blue or orange to match your brand.
-
Recommended For
Suited for AI platform founders, VC fund managers, and IR teams needing to prove competitive advantages with side-by-side metrics and a case study example in investor presentations.
-
Slide Structure
One 16:9 slide — a four-column comparison table (Traditional / Our AI / Result) and a case study panel with a four-step flow below. Navy-blue and orange-amber variants included.
Related Products
-

Usage Analysis Graph – Visualizing Market Status
#Market and Competitor Analysis #Diagram #Graph
-

SUV Percentage Donut Graph – Market Status Analysis
#Market and Competitor Analysis #Diagram #Graph
-

Meat and Vegetable Consumption by Region – Market Status Analysis
#Market and Competitor Analysis #Graph #Other
-

Graph Trend by Instrument Session – Competitive Analysis Visualization
#Market and Competitor Analysis #Graph #Other
