Current Status as Seen in a Donut Chart – Slide Representing Competitive Advantage
RB0800025_9
- Last Update 03/23/2025
- File Size 0.2MB
- # of Slides 2
- File Format PPTX
- Slide Ratio 4:3
- Color
Keywords
About the Product
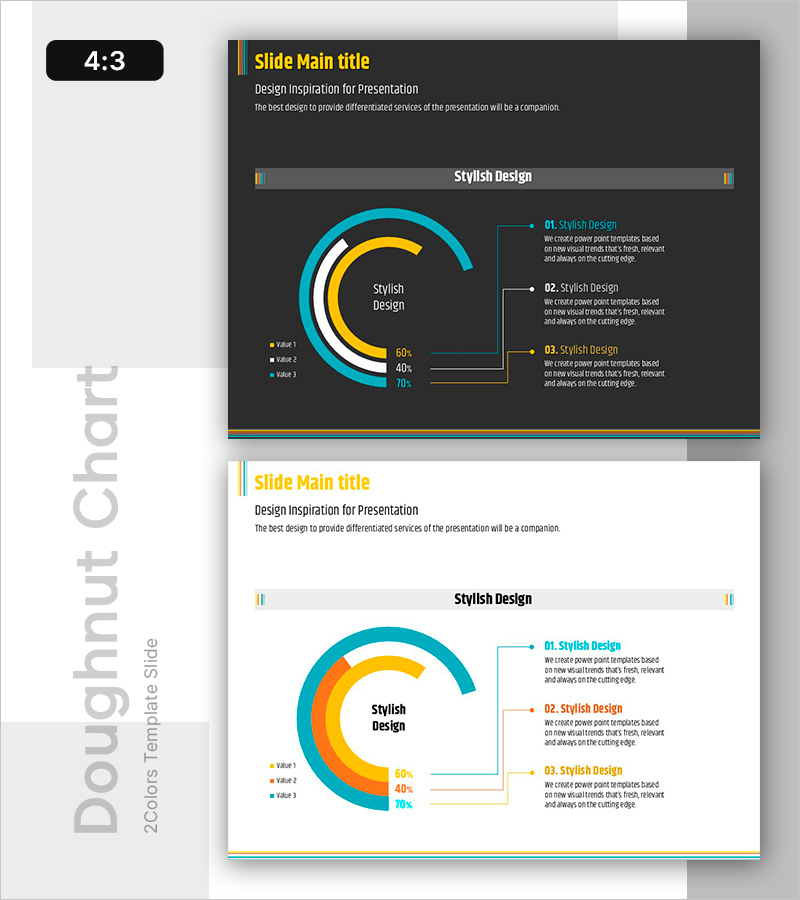
A donut chart PowerPoint slide that visualizes market status and competitive advantage at a glance. The dark background features three concentric donut segments in cyan, gold, and white, representing 60%, 40%, and 70% data ratios. Each segment includes a legend and right-aligned callout boxes for three descriptive items, making it instantly applicable to strategy reports, business analysis presentations, and marketing planning decks. The 2-slide set includes both dark and light background versions with fully editable elements.
Usage Points
-
Main Usage
Expresses multiple data ratios through concentric donut segments to intuitively communicate market share, competitor comparison, and business division composition. Enables simultaneous comparison of three data series, optimized for strategic analysis and performance reporting.
-
How to Use
Replace the donut chart percentages (60%, 40%, 70%) with your own data values and edit the right-side callout box text to add descriptions for each item. Legend colors and labels are fully customizable. Choose between the dark background and light background slide versions based on your presentation environment.
-
Recommended For
Executive and strategy team business analysis presentations, marketing team market share reports, sales team competitive comparison presentations, consulting firm strategy proposals, investor-facing business status briefings.
-
Slide Structure
2-slide set: Slide 1 features dark background (charcoal gray) with three concentric donut segments in cyan, gold, and white; left-side legend (Value 1–3); right-side three callout boxes (numbered 01–03). Slide 2 is an identical light background (white) version. All shapes, text, and colors are fully editable.
Related Products
-

Natural Recreation Area Preference Chart – Market Status Analysis
#Market and Competitor Analysis #Diagram #Graph
-

Doughnut Chart Slide for Market and Competitive Analysis – Sports Trends & Strategic Issues
#Market and Competitor Analysis #Diagram #Graph
-

Comparative Competition Donut Chart – Market and Competitor Analysis
#Market and Competitor Analysis #Graph #Market Status
-

Achievement Goals and Status Chart – Visualizing Competitive Advantage
#Market and Competitor Analysis #Graph #Market Status
