Product Analysis Comparison Graph – Visualizing Market Status
RJ0900032_5
- Last Update 08/26/2025
- File Size 2.4MB
- # of Slides 2
- File Format PPTX
- Slide Ratio 16:9
- Color
Keywords
- #Content-Based Slides
- #Design-Based Slides
- #Market and Competitor Analysis
- #Graph
- #Market Status
- #Competitive Advantage
- #Horizontal Bar
- #Grouped Horizontal Bar
- #16:9
- #horizontal bar chart PowerPoint
- #grouped bar graph template
- #product comparison slide
- #market analysis chart
- #dual-series chart PowerPoint template download
About the Product
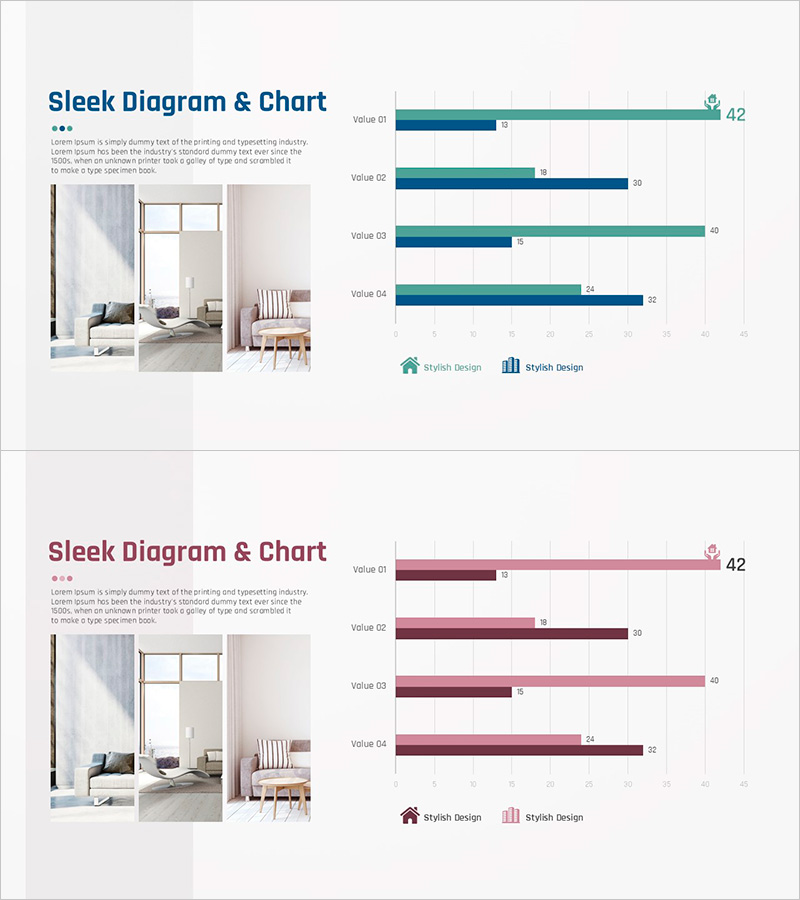
A 2-slide PowerPoint presentation for visualizing product analysis and market status. Features grouped horizontal bar charts with teal and navy blue dual-series data, comparing four items side by side. Delivered in 16:9 widescreen PPTX format with a product image area on the left and chart area on the right. Ideal for marketing reports, product presentations, and business analysis decks where you need to display competitive benchmarking, market share, sales performance, or product metrics with clear visual hierarchy.
Usage Points
-
Main Usage
Visualize product performance comparison, market analysis, and competitive benchmarking data using grouped horizontal bars. Two data series displayed side by side enable clear item-by-item comparison, while the left image area integrates product visuals with analytical data for comprehensive storytelling.
-
How to Use
Apply to market analysis sections in marketing reports, competitive advantage explanations in product decks, market status analysis in business plans, and market opportunity presentations in investor pitches. Edit chart values and labels with your actual data, and replace the left image area with product photos or screenshots.
-
Recommended For
Marketing managers, product strategists, sales executives, business analysts, and consultants presenting market conditions and product competitiveness. Particularly effective for B2B product introductions, market research presentations, and quarterly performance reports requiring data-driven decision support.
-
Slide Structure
2-slide layout. Each slide divided into left image area (3-photo grid) and right chart area. Right side displays Value 01–04 items with teal and navy horizontal bars, numeric labels at bar ends, legend, and axis labels. Fully editable data fields and color-coded series.
Related Products
-

Visualizing Market Status with Horizontal Bar Chart – Emphasizing Competitive Edge
#Market and Competitor Analysis #Graph #Market Status
-

Natural Environment Horizontal Bar Graph – Market Analysis
#Market and Competitor Analysis #Graph #Market Status
-

Comparison of Services from Other Brands – Identifying Competitive Advantages
#Market and Competitor Analysis #Graph #Competitive Advantage
-

3D Bar Graph for Market Performance Analysis – Slide Highlighting Competitive Edge
#Market and Competitor Analysis #Graph #Market Status
