AI Investment KPI Slide – Dark Diamond Cards PowerPoint
RM0500013_13
- Last Update 04/24/2026
- File Size 16.7MB
- # of Slides 2
- File Format PPTX
- Slide Ratio 16:9
- Color
Keywords
- #Content-Based Slides
- #Business Strategy
- #Financial Plans and Performance
- #Achievements
- #Projected Return on Investment (ROI)
- #Sales and Revenue
- #16:9
- #AI investment KPI PowerPoint slide
- #diamond metric card dark presentation template
- #investment performance results slide deck
- #KPI summary trophy PowerPoint
- #success rate return metric presentation
- #investor performance report slide
About the Product
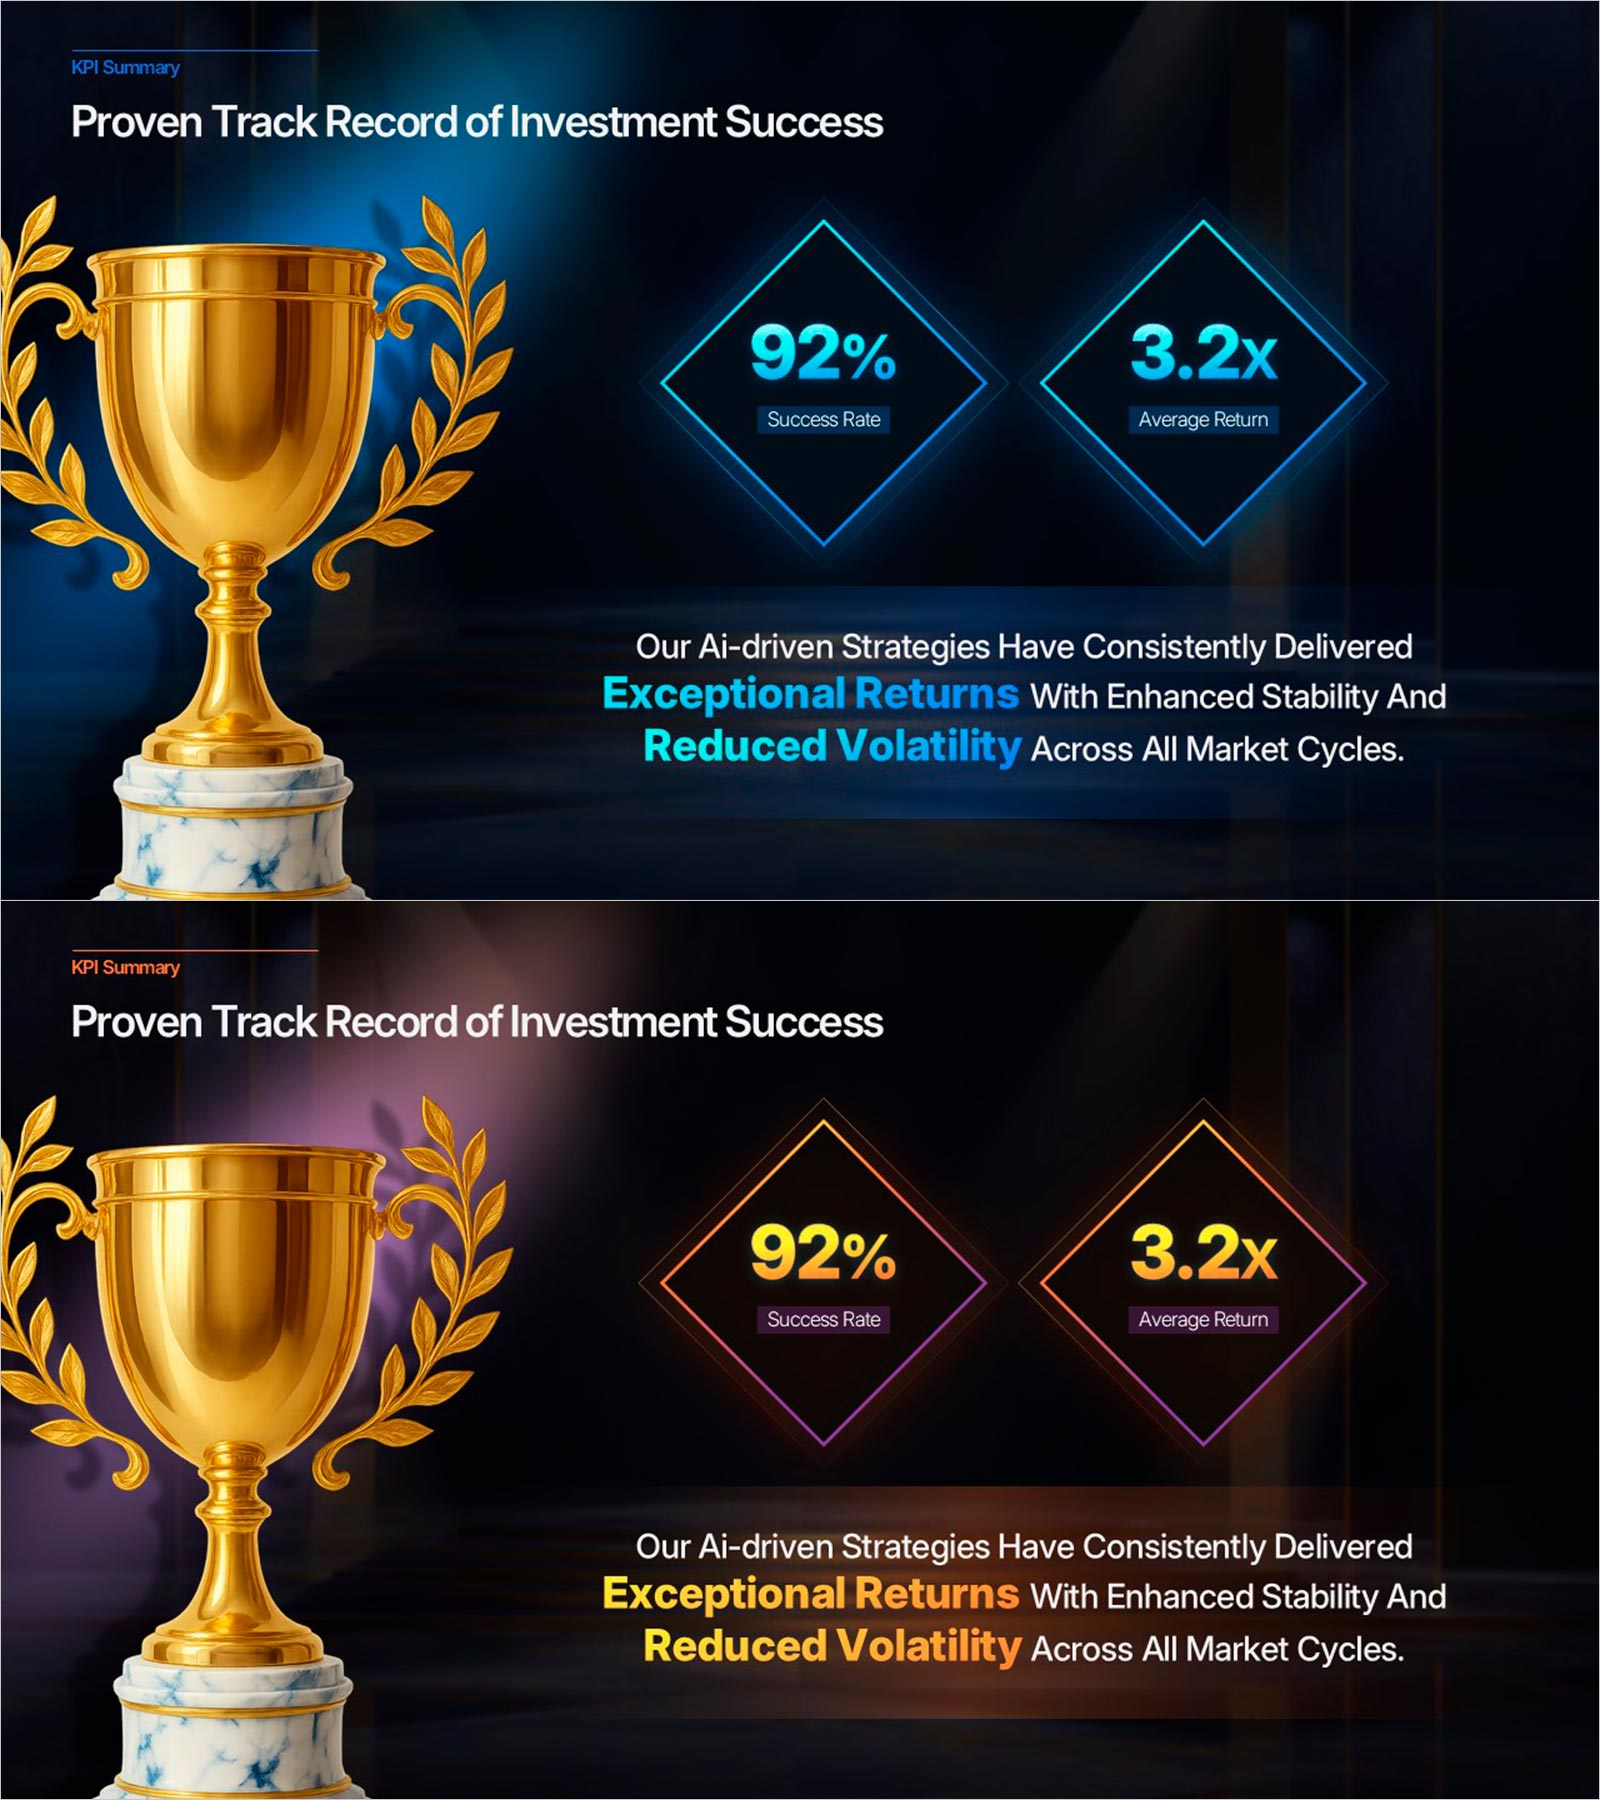
This dark PowerPoint slide presents AI investment performance using a 3D gold trophy and two glowing diamond metric cards. The trophy fills the left side; two diamond cards in the center display 92% Success Rate and 3.2x Average Return in large bold numbers. A text block below highlights 'Exceptional Returns' and 'Reduced Volatility' in cyan to convey consistent AI-driven results. A dark purple variant with orange-amber accents is also included. Edit metrics and text in PowerPoint for pitch decks, performance reports, and KPI summaries.
Usage Points
-
Main Usage
Present AI investment KPI results — 92% success rate and 3.2x returns — with a gold trophy visual and diamond cards, ideal for IR pitch decks and investor performance reports.
-
How to Use
Replace the metric numbers and labels on each diamond card, then update the bold text with your results. Choose navy-blue or purple to match your brand and insert into a pitch deck.
-
Recommended For
Suited for AI platform founders, IR managers, and VC analysts presenting fund performance, success rates, and return metrics in pitch decks and investor reports.
-
Slide Structure
One 16:9 slide — gold trophy (left), two glowing diamond metric cards (center), and a bold highlight text block (bottom). Navy-blue and orange-amber variants included.
Related Products
-

Revenue Breakthrough: Achieving All-Time Highs with Bar Graphs
#Business Strategy #Financial Plans and Performance #Graph
-

Breaking Sales Records – Visualizing Performance
#Business Strategy #Financial Plans and Performance #Graph
-

Analysis of Factors Contributing to Excellent Sales Performance – Visualizing Success
#Business Strategy #Financial Plans and Performance #Graph
-

Color-highlighted Bar Graphs and Tables – Optimized for Financial Analysis
#Financial Plans and Performance #Diagram #Graph
