Marketing Performance Dashboard Slide for KPI Summary and Channel Analysis
RM0400018_10
- Last Update 01/26/2026
- File Size 12.7MB
- # of Slides 2
- File Format PPTX
- Slide Ratio 16:9
- Color
Keywords
- #Content-Based Slides
- #Company Introduction
- #Business Strategy
- #Marketing Plan and Strategy
- #Key Achievements
- #Key Marketing Activities
- #Project Progress
- #16:9
- #marketing dashboard PowerPoint slide
- #KPI summary presentation
- #performance analysis slide
- #channel comparison PPT
- #marketing metrics dashboard template
About the Product
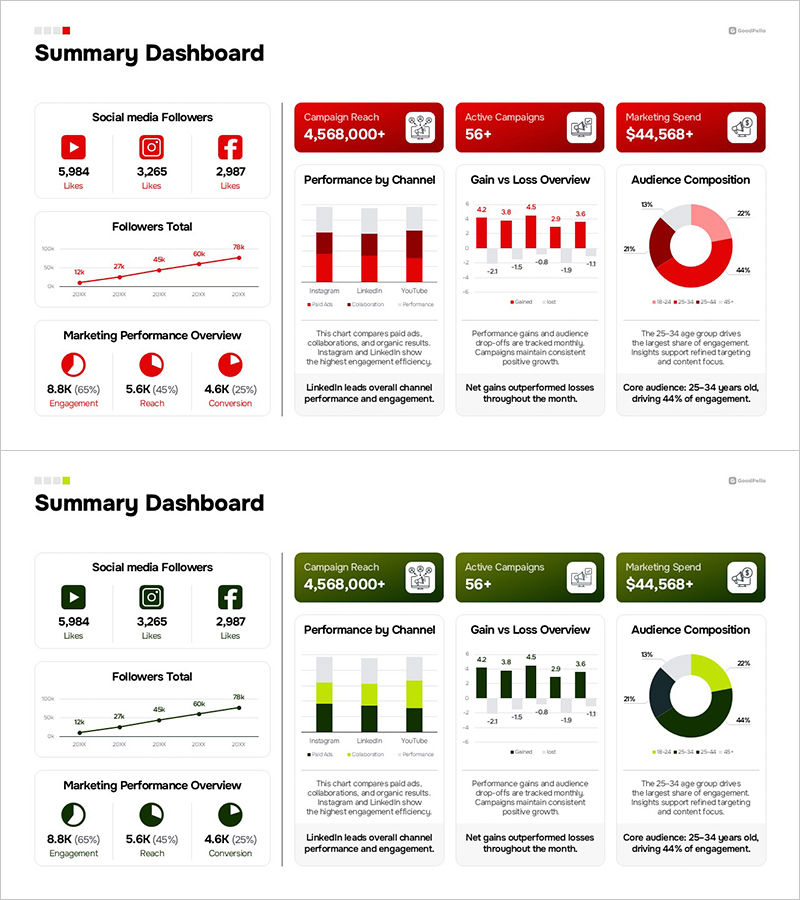
A dashboard-style PowerPoint slide that displays marketing performance metrics at a glance. Key performance indicators including social media followers, campaign reach, active campaigns, and marketing spend are summarized in card format, while channel performance comparison, gain vs. loss overview, and audience composition are visualized through charts. Available in two color versions (red and green), each section includes insight description areas for immediate use in executive reports, marketing team meetings, and investor presentations. 16:9 widescreen format, PPTX file type, 2-slide composition.
Usage Points
-
Main Usage
A dashboard slide designed to clearly communicate monthly and quarterly marketing performance to executives and stakeholders. Core KPIs such as social media follower growth, campaign reach, and marketing spend are organized in card format, while channel performance comparison and gain/loss trends are visualized through charts to support data-driven decision-making.
-
How to Use
Use in marketing performance review meetings, quarterly executive presentations, and investor pitches to explain marketing efficiency. Replace KPI card numbers and chart data with actual performance figures, then populate insight text areas with analysis findings and improvement recommendations to complete your presentation.
-
Recommended For
Marketing managers, marketing directors, executives, CFOs, and business analysts presenting performance reports and strategy discussions. Particularly valuable for social media, digital marketing, and performance-driven organizations conducting monthly or quarterly results reviews.
-
Slide Structure
Slide 1: Social media followers across 3 channels, 3 metric cards (campaign reach, active campaigns, marketing spend), channel performance comparison bar chart, gain vs. loss trend line chart, and audience composition pie chart. Slide 2: Marketing overview with 3 key metrics (engagement, reach, conversion), stacked channel performance chart, gain/loss trend line chart, audience composition pie chart, and insight text areas.
Related Products
-

Table of Experimental Key Results – Emphasizing Data and Visuals
#Company Introduction #Business Strategy #Diagram
-

Problem Definition PowerPoint Slide – 4-Step Flow Diagram
#Company Introduction #Business Strategy #Diagram
-

Vertical Bar Graph for Vision Growth – Business Development Strategy
#Company Introduction #Business Strategy #Graph
-

Red Blue Strategy Flow – Business Progress and Achievements
#Company Introduction #Business Strategy #Key Achievements
