Red Blue Strategy Flow – Business Progress and Achievements
RJ0500035_6
- Last Update 06/16/2025
- File Size 0.3MB
- # of Slides 2
- File Format PPTX
- Slide Ratio 16:9
- Color
Keywords
About the Product
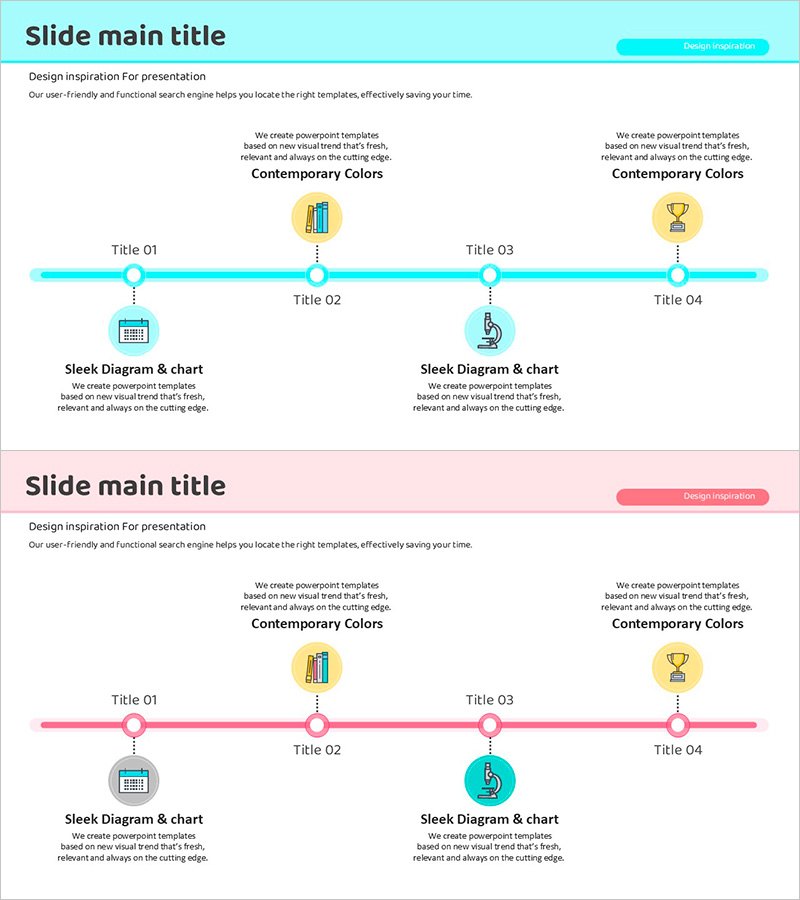
A horizontal timeline PowerPoint slide that visually communicates business progress and achievements across four stages. The design uses red and blue dual-tone colors to distinguish different phases, with circular nodes connected by a central line representing each milestone. The slide includes a title section at the top, four icon-labeled stages in the middle, and detailed text boxes below for stage-specific information. This 2-slide template is ideal for executive presentations, quarterly business reviews, and stakeholder updates. The layout supports both quantitative metrics and qualitative descriptions, making it effective for progress reports, milestone tracking, and strategic planning communications.
Usage Points
-
Main Usage
Clearly present business progress across four sequential stages with visual distinction between completed, in-progress, and planned phases. The dual-tone color scheme and icon system enable quick comprehension of project status, while text areas accommodate both metrics and narrative descriptions.
-
How to Use
Use in executive briefings, quarterly business reviews, investor presentations, and stakeholder updates. Enter stage names, dates, and key metrics in each node, then add detailed descriptions in the text boxes below. Customize colors and icons to match your organization's branding.
-
Recommended For
Business leaders, project managers, operations teams, and marketing professionals presenting progress updates. Ideal for quarterly performance reviews, investor relations presentations, customer status reports, and internal team communications.
-
Slide Structure
Two-slide layout with title section (1 line), central timeline with 4 connected nodes and icons, and 4 detailed text input areas below. Each stage has dedicated space for metrics, descriptions, and supporting information, creating a clear information hierarchy.
Related Products
-

Problem Definition PowerPoint Slide – 4-Step Flow Diagram
#Company Introduction #Business Strategy #Diagram
-

Marketing Performance Dashboard Slide for KPI Summary and Channel Analysis
#Company Introduction #Business Strategy #Marketing Plan and Strategy
-

Vertical Bar Graph for Vision Growth – Business Development Strategy
#Company Introduction #Business Strategy #Graph
-

Table of Experimental Key Results – Emphasizing Data and Visuals
#Company Introduction #Business Strategy #Diagram
