Table of Experimental Key Results – Emphasizing Data and Visuals
RJ0400006_10
- Last Update 05/18/2025
- File Size 1MB
- # of Slides 2
- File Format PPTX
- Slide Ratio 16:9
- Color
Keywords
About the Product
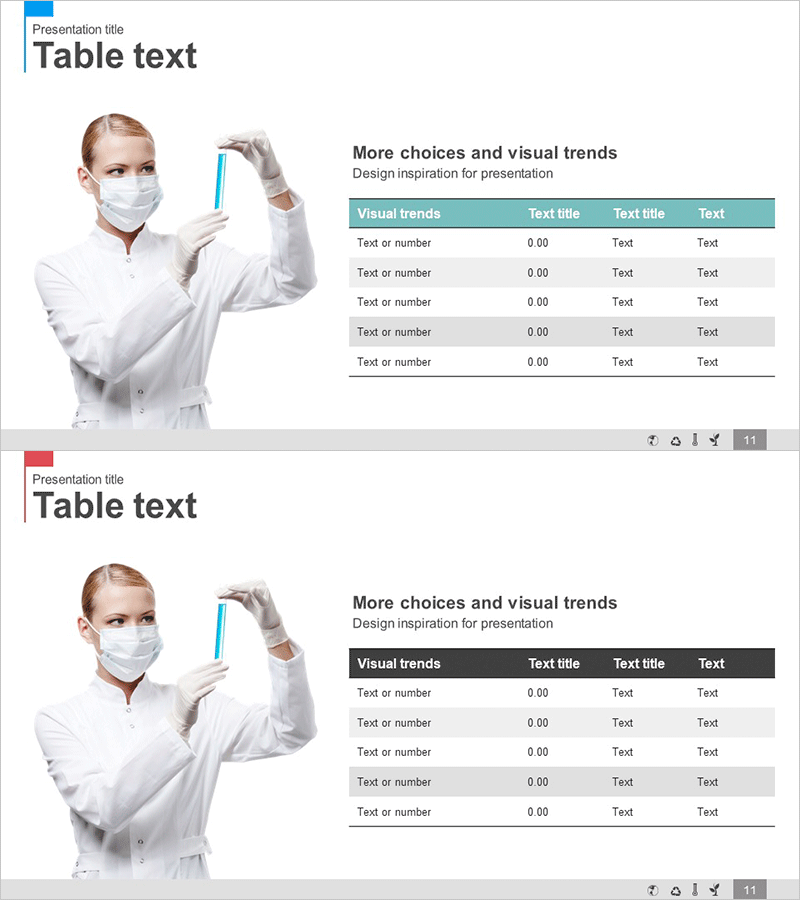
A 5-row data table PowerPoint slide designed to present experimental results and key performance metrics with clarity and precision. The teal header row and alternating white-gray row backgrounds enhance data readability and enable efficient comparison of numerical and text entries. This slide template is ready to use in research presentations, laboratory reports, and business progress briefings to visualize quantitative outcomes and analytical findings.
Usage Points
-
Main Usage
Organize experimental data, business performance metrics, and analytical results in a structured table format to communicate quantitative information clearly to your audience. The alternating row colors and teal header enhance visual hierarchy and credibility in reports and presentations.
-
How to Use
Open the slide and populate each table cell with your experiment labels, numerical values, and analysis results. The header formatting and row colors are pre-configured, so you only need to replace the placeholder text with your data. Rows can be added or colors adjusted as needed for your specific presentation.
-
Recommended For
Ideal for researchers, laboratory managers, business development teams, quality assurance specialists, and marketing analysts presenting performance reports, data analysis findings, and project progress updates. Suitable for academic presentations, corporate briefings, and project evaluation meetings requiring credible data visualization.
-
Slide Structure
Teal header row (Visual trends·Text title·Text title·Text) followed by 5 data rows with input fields for text, numerical values, and additional text entries. White and gray alternating backgrounds distinguish each row, with a bottom border line emphasizing table boundaries. Optimized for 16:9 widescreen format in a 2-slide set.
Related Products
-

Red Blue Strategy Flow – Business Progress and Achievements
#Company Introduction #Business Strategy #Key Achievements
-

Award Certification Record Sheet – Achievements and Trust
#Company Introduction #Diagram #Awards and Certifications, and Patents
-

Key Performance Income Analysis Table – Clear Understanding of Business Performance
#Company Introduction #Financial Plans and Performance #Diagram
-

Vertical Bar Graph for Vision Growth – Business Development Strategy
#Company Introduction #Business Strategy #Graph
