Path to Revenue Expansion Slide – Scalable Growth Strategy
RM0100024_16
- Last Update 12/21/2025
- File Size 12.6MB
- # of Slides 2
- File Format PPTX
- Slide Ratio 16:9
- Color
Keywords
- #Content-Based Slides
- #Design-Based Slides
- #Business Vision and Strategy
- #Financial Plans and Performance
- #Graph
- #Business Strategy
- #Sales and Revenue
- #Column
- #Column Chart
- #16:9
- #quarterly revenue chart PowerPoint
- #growth strategy slide template
- #business roadmap presentation
- #expansion strategy diagram
- #investor pitch deck
- #executive dashboard PowerPoint
About the Product
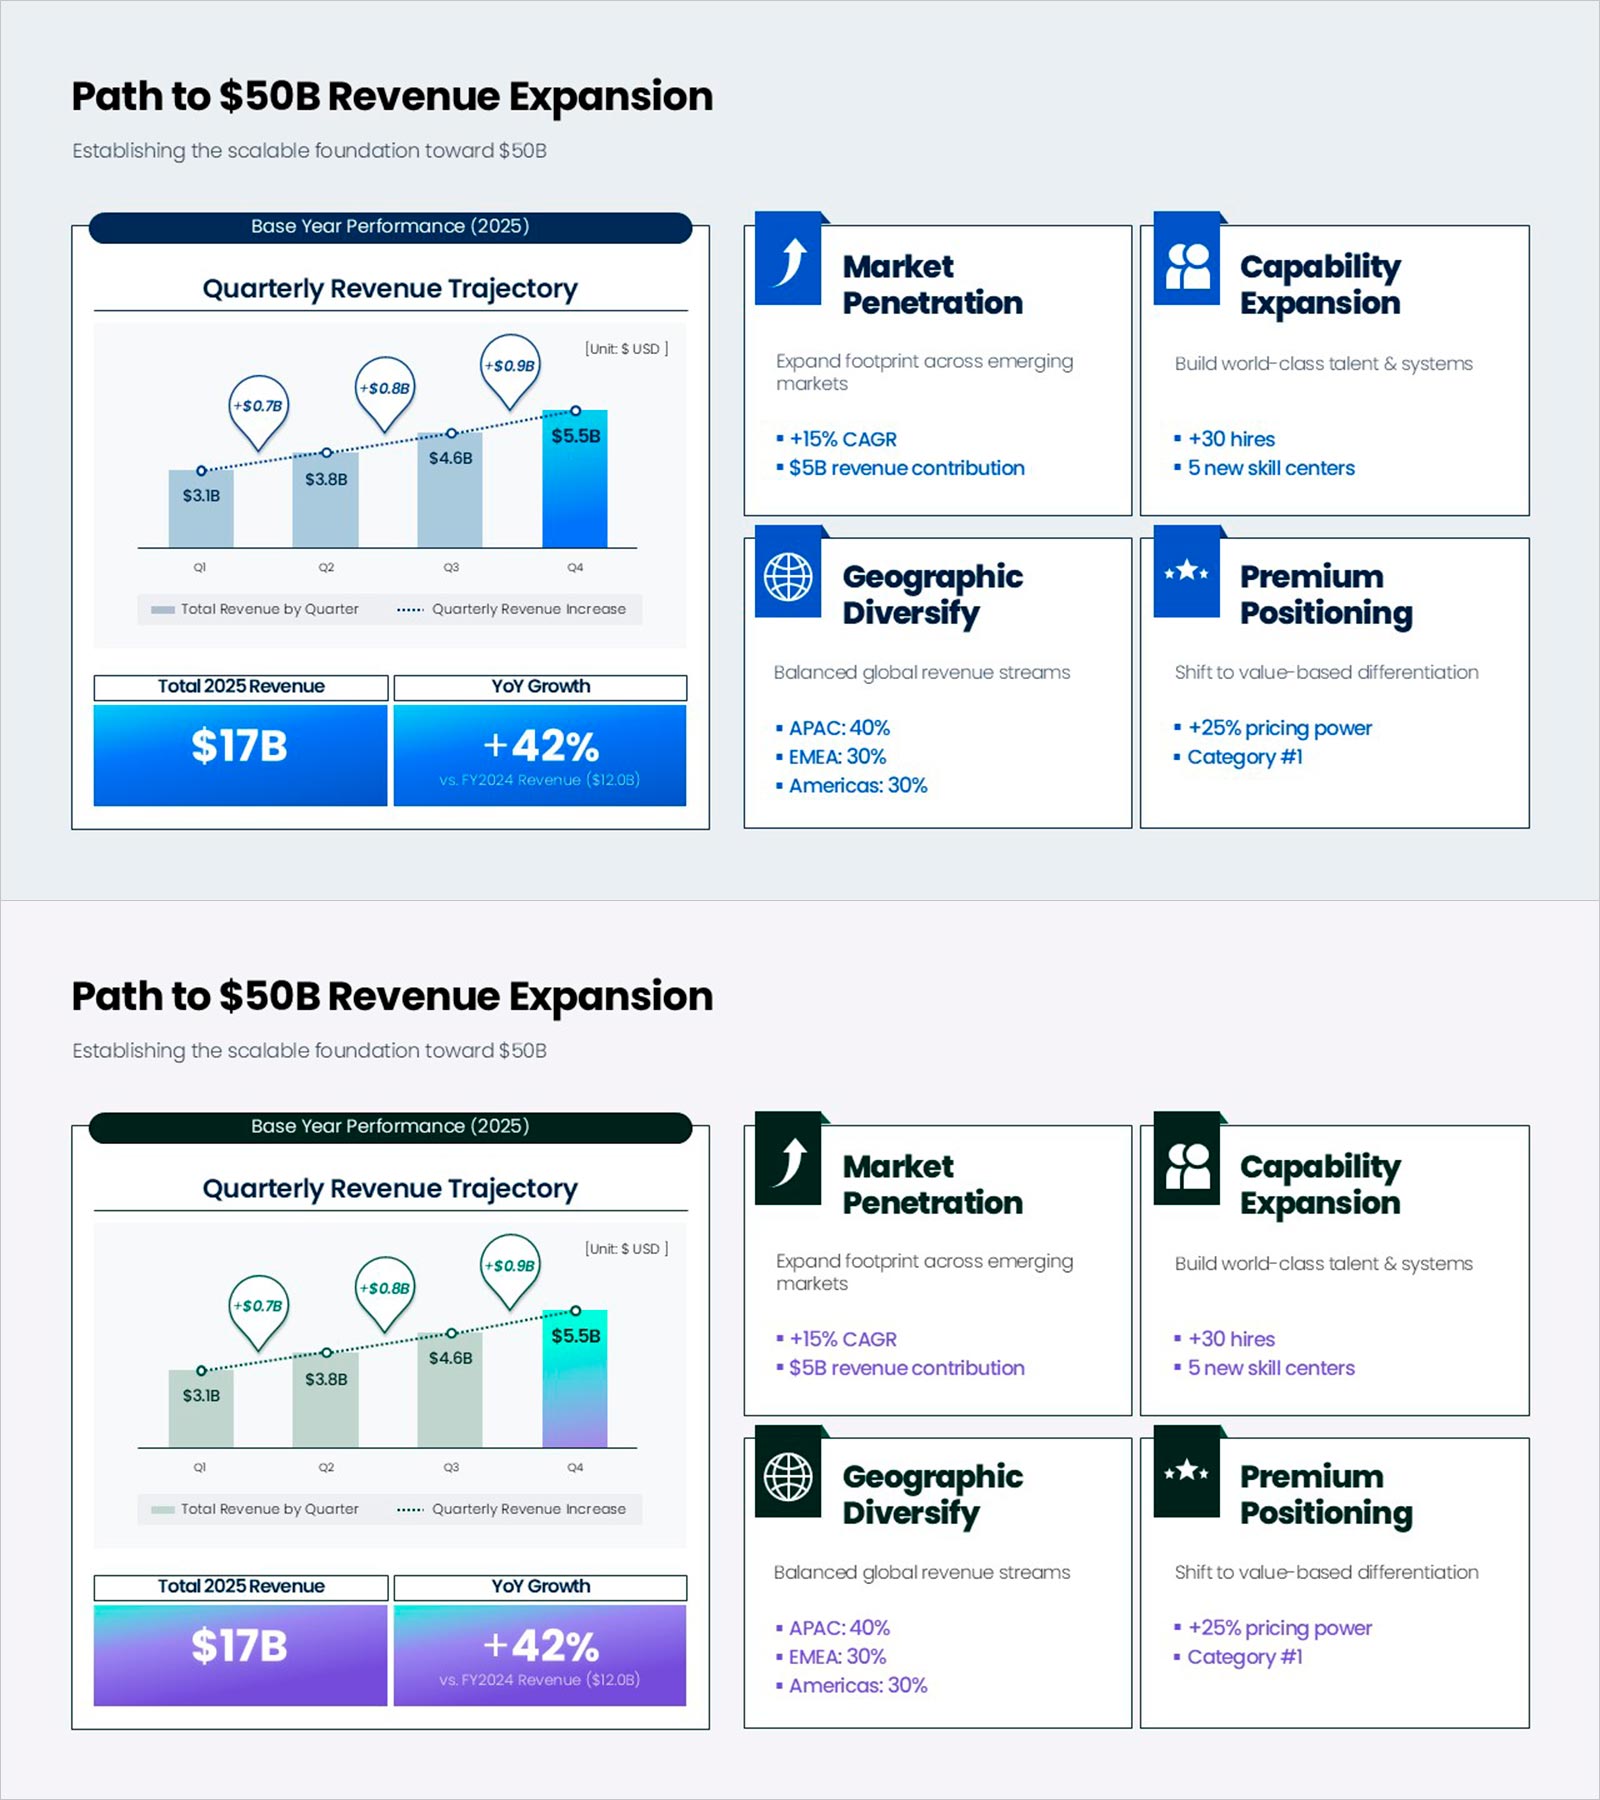
A professional PowerPoint slide visualizing quarterly revenue growth trajectory and four-pillar expansion strategy. The slide combines a bar chart showing Q1-Q4 revenue progression with four strategy boxes featuring icons, titles, and supporting metrics. The consistent blue color palette and directional arrows emphasize upward momentum, while the layout clearly separates data visualization from strategic initiatives. Designed for executive presentations, investor pitches, and board-level business strategy discussions. Fully editable PPTX format with 16:9 aspect ratio for seamless integration into corporate presentations.
Usage Points
-
Main Usage
Communicate quarterly revenue performance alongside four strategic pillars—market penetration, capability expansion, geographic diversification, and premium positioning—in a single cohesive visual. Enables executives and investors to understand both financial trajectory and the strategic drivers behind growth targets.
-
How to Use
Slide 1 presents the quarterly revenue bar chart (Q1–Q4) with growth percentages and dollar amounts. Slide 2 displays the four strategy boxes in a 2×2 grid layout, each with an icon, title, bullet points, and key metrics. Replace placeholder text and numbers with your actual business data, then customize colors or icons to match corporate branding if needed.
-
Recommended For
CFOs, business development executives, strategy teams, and investor relations professionals presenting quarterly results, mid-term business plans, investor updates, or board-level strategy reviews. Ideal for scenarios requiring simultaneous communication of financial performance and strategic diversification initiatives.
-
Slide Structure
Slide 1: Quarterly revenue visualization with 4-bar chart (Q1–Q4), revenue amounts per quarter, quarterly growth rate indicators, and trend arrows. Slide 2: 2×2 grid layout with four strategy boxes—Market Penetration (top-left), Capability Expansion (top-right), Geographic Diversification (bottom-left), Premium Positioning (bottom-right)—each containing icon, heading, descriptive text, and supporting metrics.
Related Products
-

Column Chart for PowerPoint – Visualization of Market Analysis and Performance
#Market and Competitor Analysis #Financial Plans and Performance #Graph
-

Visualizing Business Strategies with Tables & Charts – Clear Data Presentation
#Business Strategy #Financial Plans and Performance #Diagram
-

Renewable Energy Market Analysis Horizontal Bar Chart – Successful Strategies for Carbon Neutrality
#Market and Competitor Analysis #Financial Plans and Performance #Corporate Social Responsibility
-

Car Wide Template Vertical Bar Graph – Market Analysis and Competitive Advantage
#Market and Competitor Analysis #Financial Plans and Performance #Graph
