Step-by-step Schedule Diagram – Visualizing Business Strategy
RM0100004_16
- Last Update 01/25/2025
- File Size 3.4MB
- # of Slides 2
- File Format PPTX
- Slide Ratio 16:9
- Color
Keywords
- #Content-Based Slides
- #Design-Based Slides
- #Product/Service Introduction
- #Business Strategy
- #Diagram
- #Features
- #Step-by-Step Schedule Plan
- #Flow
- #Linear Flow
- #16:9
- #circular diagram PowerPoint
- #4-step process slide
- #business strategy diagram
- #flow chart slide template
- #step-by-step schedule PowerPoint
About the Product
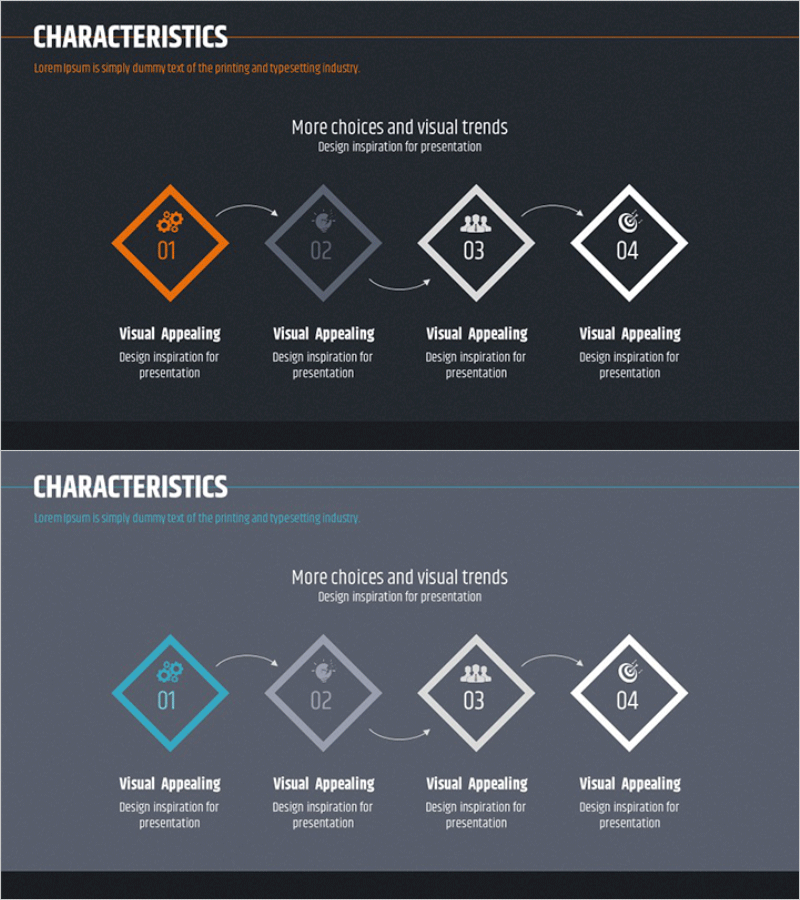
A PowerPoint slide that visualizes business execution stages through a 4-node circular flow structure. Diamond-shaped nodes with numbers and icons are connected by arrows to clearly represent process progression. Three color schemes—orange, gray, and white—emphasize each stage, with descriptive text areas below each node. Ready to use in business plans, strategy reports, and project timeline presentations.
Usage Points
-
Main Usage
Breaks down business execution stages, project timelines, and circular processes into 4 distinct steps with visual clarity. Arrows explicitly show sequence and relationships, enhancing audience comprehension of workflow progression.
-
How to Use
Enter stage names, objectives, and owners in each diamond node. Replace icons to match your business context. Modify colors to represent priority levels or importance hierarchy across stages.
-
Recommended For
Ideal for business plans, strategy reports, project kickoff presentations, marketing campaign timelines, organizational restructuring announcements, and quality management process explanations. Effective for executives, team leads, and project managers presenting phased execution plans.
-
Slide Structure
2-slide set with first slide featuring orange-highlighted node among 4 diamond shapes, second slide with blue-highlighted node in identical layout. Each node contains number, icon, and text area; curved arrows connect nodes in clockwise direction.
Related Products
-

Car Maintenance Service Process – Visualized Step-by-Step Flow
#Product/Service Introduction #Business Strategy #Diagram
-

Galaxy Theme Attribute Connection Diagram – Engaging Business Development
#Product/Service Introduction #Business Strategy #Diagram
-

Marketing Promotion Plan Flow Diagram - Efficient Business Strategy
#Business Strategy #Business Management #Operational Plan
-

The Process of Becoming a Successful Magician - Path to Success
#Business Strategy #Operational Plan #Diagram
