Galaxy Theme Attribute Connection Diagram – Engaging Business Development
RJ0400001_8
- Last Update 05/17/2025
- File Size 13.8MB
- # of Slides 2
- File Format PPTX
- Slide Ratio 16:9
- Color
Keywords
- #Content-Based Slides
- #Design-Based Slides
- #Product/Service Introduction
- #Business Strategy
- #Diagram
- #Features
- #Step-by-Step Schedule Plan
- #Flow
- #Cluster
- #Linear Flow
- #Chain Diagram
- #16:9
- #connection diagram PowerPoint
- #4-step process slide
- #linear flow diagram presentation
- #business process PPT slide
- #process flow template download
- #how to create process diagram in PowerPoint
About the Product
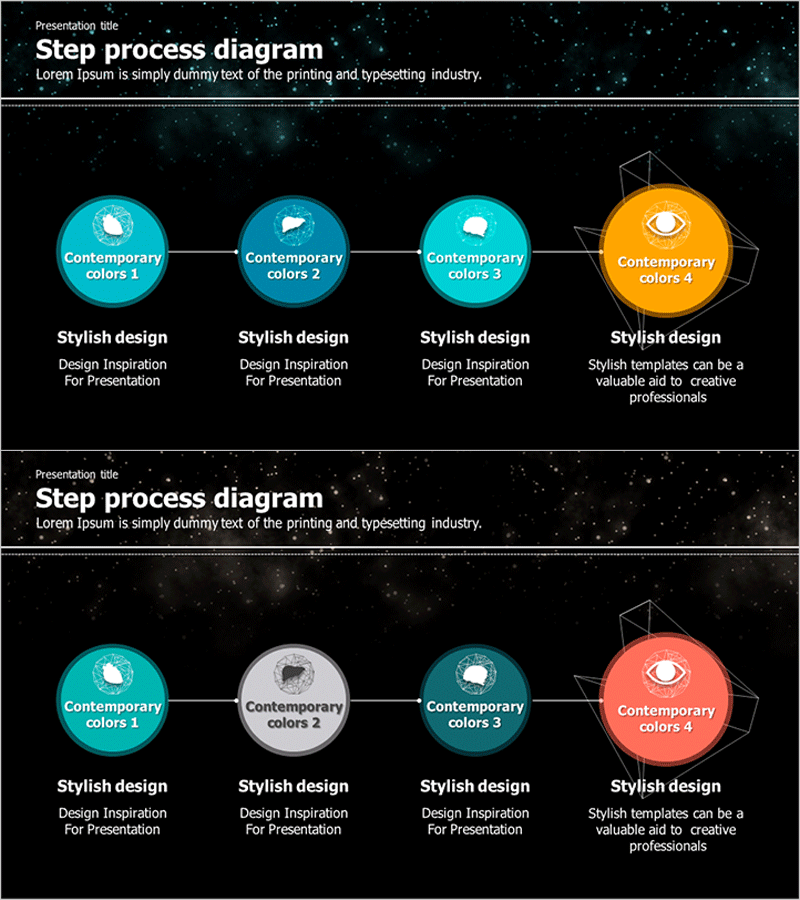
A 4-step linear connection diagram PowerPoint slide with a galaxy theme background. The design features three cyan circular nodes and one orange accent node arranged horizontally, representing a sequential business process. Each node is connected by directional arrows, with descriptive text areas positioned below for detailed information. The dark background with bright color contrast ensures high visual impact during presentations, making it ideal for business strategy execution, project phases, decision-making workflows, and process documentation. The 2-slide set offers multiple color variations, and all elements are fully editable in PPTX format.
Usage Points
-
Main Usage
Visualizes sequential workflows such as business execution phases, project timelines, decision-making processes, and strategic implementation steps. Each circular node accommodates phase names, while the text area below provides space for detailed descriptions, enabling clear communication of multi-stage initiatives to audiences.
-
How to Use
Enter phase names in the circular nodes and add corresponding objectives, activities, or outcomes in the text areas below. Customize node colors to emphasize critical or final stages, and use the connecting arrows to illustrate cause-and-effect relationships between phases.
-
Recommended For
Executives, project managers, strategic planners, and marketing professionals presenting business plans, project progress reports, marketing campaign phases, organizational change management, and operational roadmaps.
-
Slide Structure
2-slide set. Each slide displays 4 circular nodes (approximately 80px diameter) arranged horizontally from left to right, connected by directional arrows. The first three nodes are cyan (RGB 0,188,212), while the final node is orange (RGB 255,152,0) for emphasis. Each node includes a text input area below (approximately 120×60px). The background features a dark black with galaxy particle effects for visual depth.
Related Products
-

Car Maintenance Service Process – Visualized Step-by-Step Flow
#Product/Service Introduction #Business Strategy #Diagram
-

Step-by-Step Flow Diagram – Visualizing Business Strategy
#Business Vision and Strategy #Business Strategy #Diagram
-

Step-by-step Business Process Diagram – Effective Business Strategy
#Product/Service Introduction #Business Strategy #Diagram
-

Procedures for Applying for a Move-in of a Silver Town – Step-by-Step Flow Description
#Business Strategy #Operational Plan #Diagram
