Revenue Model Slide Showing Subscriptions, Ads, and Partnerships
RM0700018_4
- Last Update 12/22/2025
- File Size 14.6MB
- # of Slides 2
- File Format PPTX
- Slide Ratio 16:9
- Color
Keywords
- #Content-Based Slides
- #Design-Based Slides
- #Financial Plans and Performance
- #Graph
- #Projected Return on Investment (ROI)
- #Sales and Revenue
- #Circles
- #Pie Chart
- #16:9
- #pie chart PowerPoint slide
- #revenue model presentation
- #business model visualization
- #subscription advertising partnership chart
- #platform revenue breakdown
- #multi-stream revenue PPT
About the Product
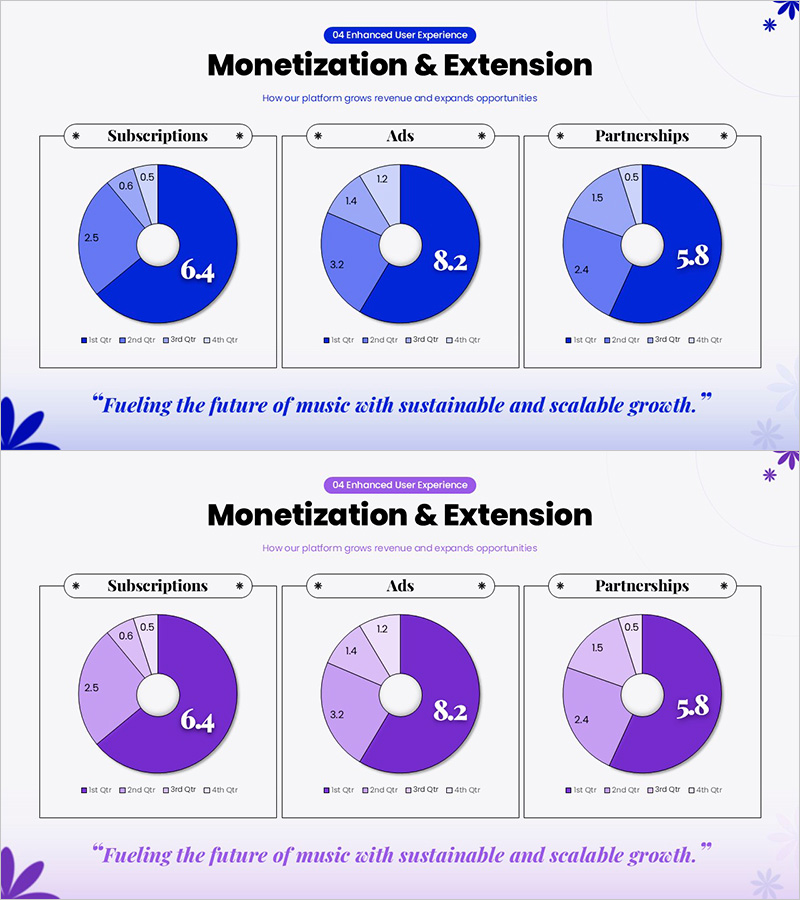
A PowerPoint slide featuring a three-segment pie chart that visualizes platform revenue streams across subscriptions, advertising, and partnerships. Each revenue category is represented with distinct color gradients (blue and purple tones) and labeled with proportional values, making it easy to communicate revenue diversification strategy. The slide includes a legend showing quarterly growth trends (Q1-Q4) for each segment, enabling clear presentation of revenue portfolio composition. Ideal for business pitch decks, investor presentations, and executive reports. Delivered in 16:9 widescreen format with 2 slides, fully editable and ready to customize with your own data.
Usage Points
-
Main Usage
Clearly communicate multi-stream revenue models by dividing platform income into three distinct categories with proportional pie chart visualization. Simultaneously display revenue composition and quarterly growth trends to demonstrate revenue diversification effectiveness and scalability potential.
-
How to Use
Insert into the revenue model section of business presentations to explain subscription fees, advertising revenue, and partnership commissions. Use in investor pitch decks to highlight revenue growth opportunities and in quarterly executive reports to track revenue structure changes across reporting periods.
-
Recommended For
Startup founders, CFOs, and finance professionals presenting to investors, stakeholders, and partners. Suitable for platform businesses, subscription services, ad-supported media companies, and B2B SaaS firms conducting business planning, quarterly reviews, and strategic presentations.
-
Slide Structure
Two-slide set. Slide 1 displays a donut-style pie chart with three segments (Subscriptions 6.4, Ads 8.2, Partnerships 5.8) and a legend showing Q1-Q4 quarterly growth rates. Slide 2 presents the same data structure in purple gradient tones for color variation. Both slides feature centered pie chart, left-side legend, and right-side messaging area.
Related Products
-

Investment and Revenue Projection Strategy Slide
#Financial Plans and Performance #Graph #Projected Return on Investment (ROI)
-

Toy Image and Table – Emphasizing Financial Planning
#Financial Plans and Performance #Diagram #Projected Return on Investment (ROI)
-

Circular Gradient Wide Template Pie chart
#Company Introduction #Financial Plans and Performance #Graph
-

Visualizing Market Share with Pie Chart – Successful Investment Planning
#Market and Competitor Analysis #Financial Plans and Performance #Graph
