Avocado and Strawberry Pie Chart – Market Share Analysis
RJ0800002_5
- Last Update 07/31/2025
- File Size 0.8MB
- # of Slides 2
- File Format PPTX
- Slide Ratio 16:9
- Color
Keywords
- #Content-Based Slides
- #Design-Based Slides
- #Market and Competitor Analysis
- #Financial Plans and Performance
- #Graph
- #Market Share
- #Projected Return on Investment (ROI)
- #Circles
- #Pie Chart
- #16:9
- #pie chart PowerPoint slide
- #2-segment pie chart
- #market share PowerPoint template
- #ratio visualization presentation
- #pie graph slide design
About the Product
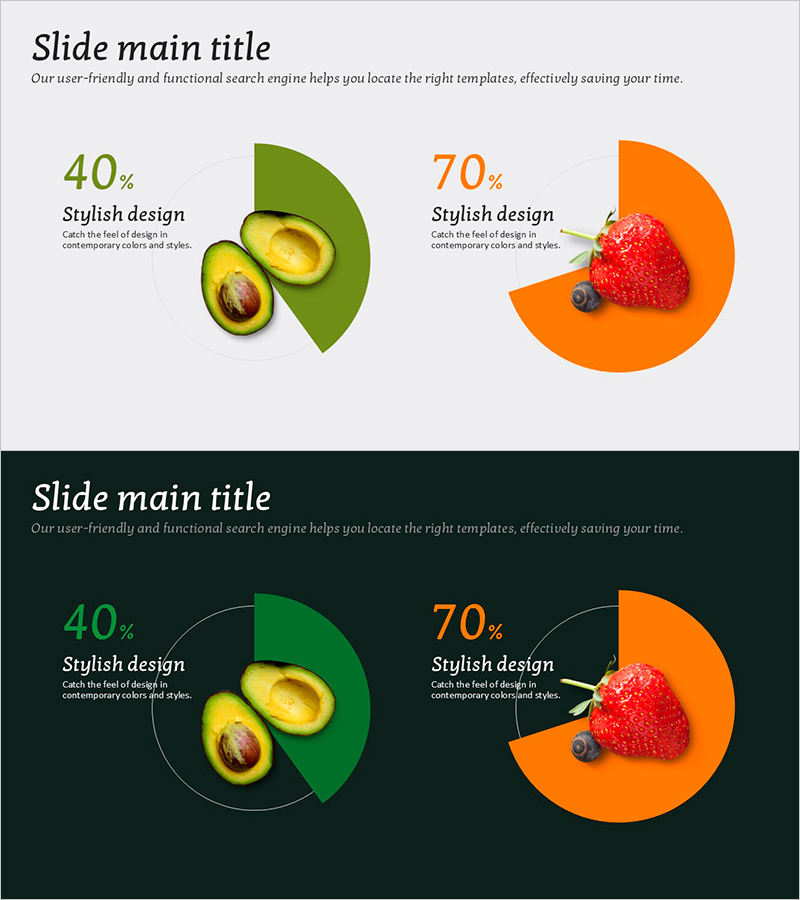
A professional 2-segment pie chart PowerPoint slide designed for market share analysis and data visualization. The design features contrasting olive green and orange color segments with real avocado and strawberry imagery overlaid on the chart sections, creating strong visual impact. Two background versions are included—light gray and dark—allowing you to select the best option for your presentation environment. This slide template is ideal for expressing financial performance, market analysis, sales ratios, and comparative business metrics in professional presentations.
Usage Points
-
Main Usage
Effectively compare and visualize two primary categories such as market share percentages, sales ratios, customer distribution, or competitive positioning. Ideal for financial reports, marketing analysis presentations, and business performance reviews where data-driven insights need clear visual communication.
-
How to Use
Use the light background version for standard conference rooms and classroom presentations, and the dark background version for projector-based or large-screen environments. Edit the percentage values and legend to match your actual data, and replace imagery as needed for immediate deployment in your presentation.
-
Recommended For
Finance teams presenting quarterly performance analysis, marketing departments reporting market share metrics, sales teams analyzing customer composition, and executive leadership preparing strategic briefings. Suitable for any business presentation requiring clear two-category data comparison.
-
Slide Structure
Two-slide template featuring identical pie chart layouts in contrasting backgrounds. Each slide displays two pie segments—olive green (40%) and orange (70%)—with corresponding avocado and strawberry product images. Formatted in 16:9 widescreen ratio for modern presentation standards and maximum visual clarity.
Related Products
-

Visualizing Market Share with Pie Chart – Successful Investment Planning
#Market and Competitor Analysis #Financial Plans and Performance #Graph
-

Age-based Market Share Analysis with Pie Chart
#Market and Competitor Analysis #Graph #Market Share
-

Market Share and Analysis Graph – Red and Blue Integration
#Market and Competitor Analysis #Graph #Market Share
-

Market Status and Share Analysis Slide – The Harmony of Blue and Orange
#Market and Competitor Analysis #Graph #Market Status
