Principal Recovery Rate Diagram
RJ0600077_14
- Last Update 07/10/2025
- File Size 6.9MB
- # of Slides 2
- File Format PPTX
- Slide Ratio 16:9
- Color
Keywords
- #Content-Based Slides
- #Design-Based Slides
- #Operational Plan
- #Financial Plans and Performance
- #Diagram
- #Text Box
- #Organizational Structure and Staffing Plan
- #Projected Return on Investment (ROI)
- #Sales and Revenue
- #Cluster
- #Combination Diagram
- #16:9
- #nested diagram PowerPoint
- #principal recovery rate slide
- #financial ratio visualization
- #cluster chart template
- #percentage breakdown PPT
About the Product
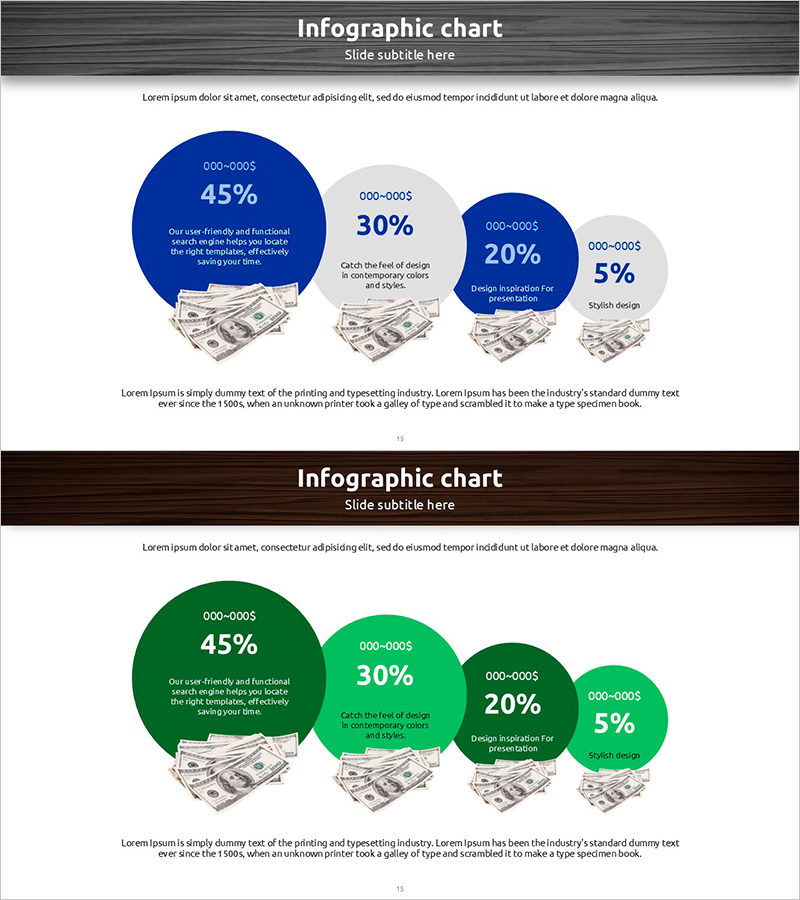
A PowerPoint slide that visualizes principal recovery rates using a 4-stage nested circular diagram. The 45%, 30%, 20%, and 5% proportions are represented by size-differentiated circles, with descriptive text and dollar icons positioned beneath each stage to convey financial data intuitively. Two color versions are provided—dark blue with light gray and deep green with bright green—allowing you to match your presentation's tone. Both slides are designed in 16:9 widescreen format for modern presentation environments, with fully editable text and numerical values for seamless customization.
Usage Points
-
Main Usage
Optimized for expressing hierarchical financial data such as investment returns, fund recovery plans, and financial performance analysis. The size difference between nested circles enables instant comprehension of relative proportions, making it ideal for executive reports, investor presentations, and financial analysis decks.
-
How to Use
Open the slide and replace each circular node's percentage values and descriptive text with your own data. Select your preferred color version (blue or green) to align with corporate branding or presentation theme, and duplicate circle shapes if additional stages are needed.
-
Recommended For
Finance managers, CFOs, investor relations (IR) professionals, management consultants, and business analysts explaining cash flows, cost allocation, revenue composition, and recovery rates. Particularly suited for financial services, insurance, real estate, and investment industry presentations requiring multi-stage ratio comparisons.
-
Slide Structure
2-slide deck. Each slide features a header section (title and subtitle), four nested circular nodes in the center (labeled 45%, 30%, 20%, 5%), descriptive text boxes below each node, and a legend text area at the bottom. Slide 1 uses blue tones; Slide 2 uses green tones with identical structural layout.
Related Products
-

Global Business PowerPoint Template – Key Clusters for Project Progress
#Business Vision and Strategy #Business Strategy #Operational Plan
-

Ice Hockey Overlap Diagram – Interconnectedness and Introduction
#Product/Service Introduction #Business Introduction #Operational Plan
-

Construction Project Objectives Overlapping Diagram – Business Vision and Strategy
#Business Vision and Strategy #Operational Plan #Diagram
-

Paper Theme Nesting Diagram – Collaboration and Communication
#Product/Service Introduction #Operational Plan #Marketing Plan and Strategy
