Investment and Revenue Projection Strategy Slide
RJ0900039_4
- Last Update 12/22/2025
- File Size 0.4MB
- # of Slides 2
- File Format PPTX
- Slide Ratio 16:9
- Color
Keywords
- #Content-Based Slides
- #Design-Based Slides
- #Financial Plans and Performance
- #Graph
- #Projected Return on Investment (ROI)
- #Sales and Revenue
- #Circles
- #Pie Chart
- #16:9
- #pie chart PowerPoint slide
- #investment allocation template
- #revenue structure analysis
- #4-segment pie chart
- #investment portfolio presentation
- #financial planning slide
- #business proposal template
About the Product
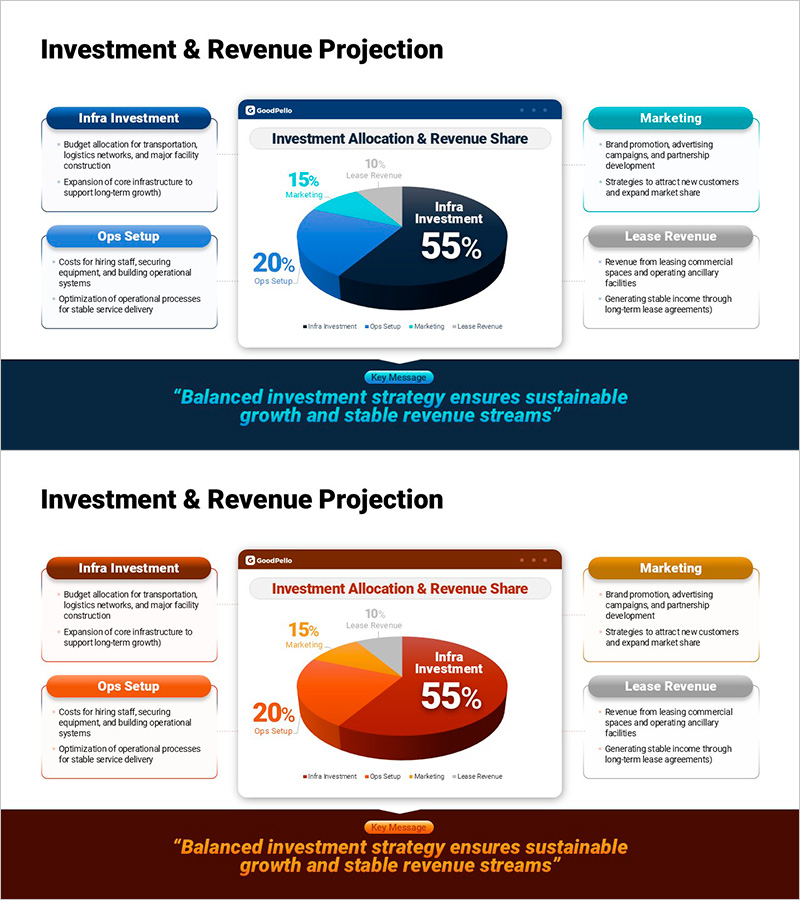
A PowerPoint slide visualizing investment allocation and revenue projection through a 4-segment pie chart. This presentation template displays investment portfolio breakdown: Infrastructure Investment 55%, Operations Setup 20%, Marketing 15%, and Lease Revenue 10% in a single, easy-to-understand format. The design uses dark blue, turquoise, and gray color segments to distinguish each investment category clearly. Left-side text boxes provide detailed descriptions for each investment area, while the right-side pie chart supports real-time data linking for dynamic updates. Ideal for business proposals, investor pitch decks, and urban development project planning presentations where fund allocation strategy needs to be communicated persuasively to stakeholders.
Usage Points
-
Main Usage
Clearly visualizes investment portfolio fund distribution and revenue structure breakdown across four key areas: Infrastructure Investment, Operations Setup, Marketing, and Lease Revenue. The pie chart displays percentage allocation while accompanying text boxes explain the strategic rationale and expected outcomes for each investment category.
-
How to Use
Use in business plan investment strategy sections, investor pitch presentations, and real estate or infrastructure project planning phases. Edit pie chart segments by clicking to modify colors, percentages, and labels. Input detailed descriptions in text boxes to explain each investment area's purpose, timeline, and revenue expectations.
-
Recommended For
Finance managers, business planning teams, investor relations professionals, real estate developers, and infrastructure project managers presenting fund allocation strategies. Effective for executive briefings, investor meetings, and internal strategy sessions emphasizing portfolio balance and revenue sustainability.
-
Slide Structure
Title area (Investment & Revenue Projection), three left-side text boxes (Infra Investment, Ops Setup, Marketing, Lease Revenue descriptions), center 4-segment pie chart (Infra 55% dark blue, Ops 20% blue, Marketing 15% turquoise, Lease 10% gray), legend area. 16:9 widescreen format, 2-slide set.
Related Products
-

Revenue Model Slide Showing Subscriptions, Ads, and Partnerships
#Financial Plans and Performance #Graph #Projected Return on Investment (ROI)
-

Graph Slide Showing Status of Food Truck Sales
#Financial Plans and Performance #Diagram #Graph
-

Analyzing Your Favorite Food Mix Chart – Attractive Data Visualization
#Financial Plans and Performance #Graph #Other
-

Energy Battery Growth Graph Slide
#Financial Plans and Performance #Graph #Projected Return on Investment (ROI)
