Startup Traction Slide Highlighting Growth Metrics and Achievements
RM0500012_7
- Last Update 01/26/2026
- File Size 17.2MB
- # of Slides 2
- File Format PPTX
- Slide Ratio 16:9
- Color
Keywords
About the Product
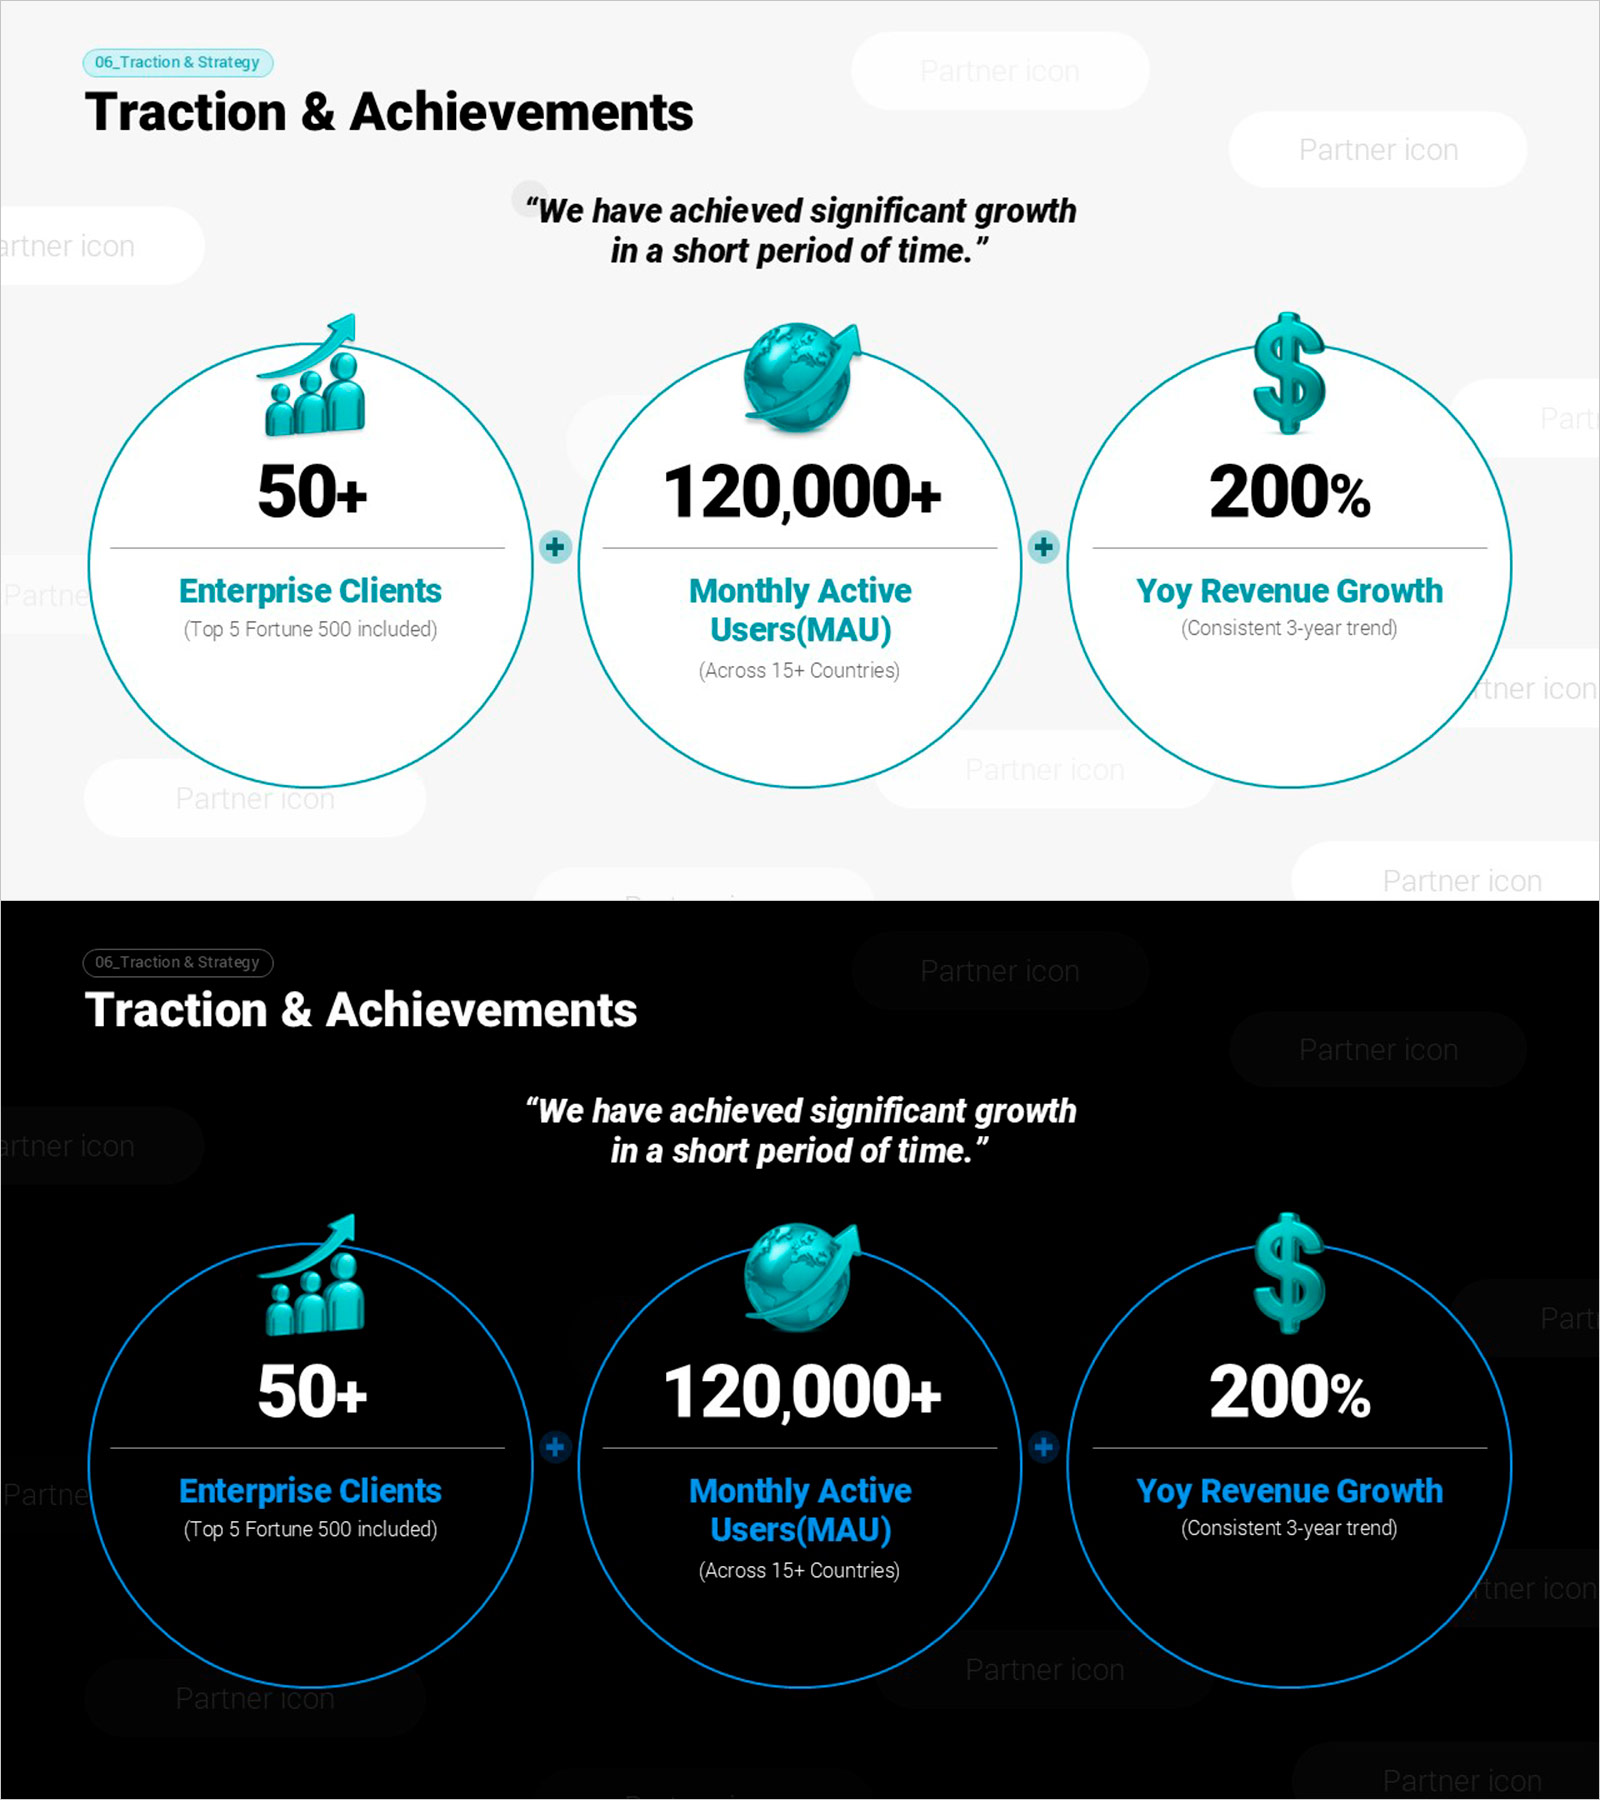
A professional traction slide designed to showcase startup and growth company achievements at a glance. This PowerPoint template visualizes three critical metrics—enterprise clients, monthly active users (MAU), and revenue growth—using three interconnected circular diagrams with teal icons and clean typography. The layout effectively communicates business momentum to investors, partners, and stakeholders. Each circle contains an icon, numerical value, metric label, and supporting description. Available in both light and dark background versions, this PPTX slide is fully editable and ready for pitch decks, investor presentations, and quarterly business reviews.
Usage Points
-
Main Usage
This slide enables startups and growth companies to quantitatively demonstrate business performance to investors, partners, and internal teams. By presenting customer acquisition, user growth, and revenue metrics simultaneously, it establishes credibility and showcases momentum.
-
How to Use
Use this slide as the opening of your traction or achievements section in investor pitches, quarterly business reviews, partnership proposals, and board presentations. Replace the sample numbers and labels with your actual metrics, and adjust colors and icons to match your brand identity if needed.
-
Recommended For
Startup founders, CEOs, investor relations teams, and business development professionals presenting to venture capitalists, corporate partners, and stakeholders. Particularly effective for early-stage companies demonstrating rapid growth and market traction.
-
Slide Structure
The slide features a title, italicized quote, and three circular metric displays. Each circle contains an icon (people, globe, dollar sign), a large numerical value, a metric label in teal, and a brief description. Connecting elements between circles create visual cohesion. Both light and dark background versions are included for presentation flexibility.
Related Products
-

Visualizing Successful Business Performance with Horizontal Bar Chart
#Company Introduction #Business Strategy #Graph
-

Chart Analysis of External Activities – Performance and Strategy
#Company Introduction #Business Strategy #Diagram
-

Business Data Overview Slide - Performance Visualization
#Company Introduction #Business Strategy #Graph
-

Visualizing Key Achievements with Blue Line Donut Chart – Business Strategy
#Company Introduction #Business Strategy #Graph
