Business Outcome PowerPoint Slide – 3-Circle Solution Hub
RBTK0700003_3
- Last Update 05/21/2026
- File Size 13.4MB
- # of Slides 2
- File Format PPTX
- Slide Ratio 16:9
- Color
Keywords
- #Content-Based Slides
- #Design-Based Slides
- #Company Introduction
- #Business Strategy
- #Diagram
- #Key Achievements
- #Achievements
- #Spread
- #Centralized Diagram
- #16:9
- #business outcome PowerPoint slide
- #solution impact presentation template
- #three-circle Venn hub slide deck
- #IT solution ROI presentation slide
- #AI automation business impact PowerPoint
About the Product
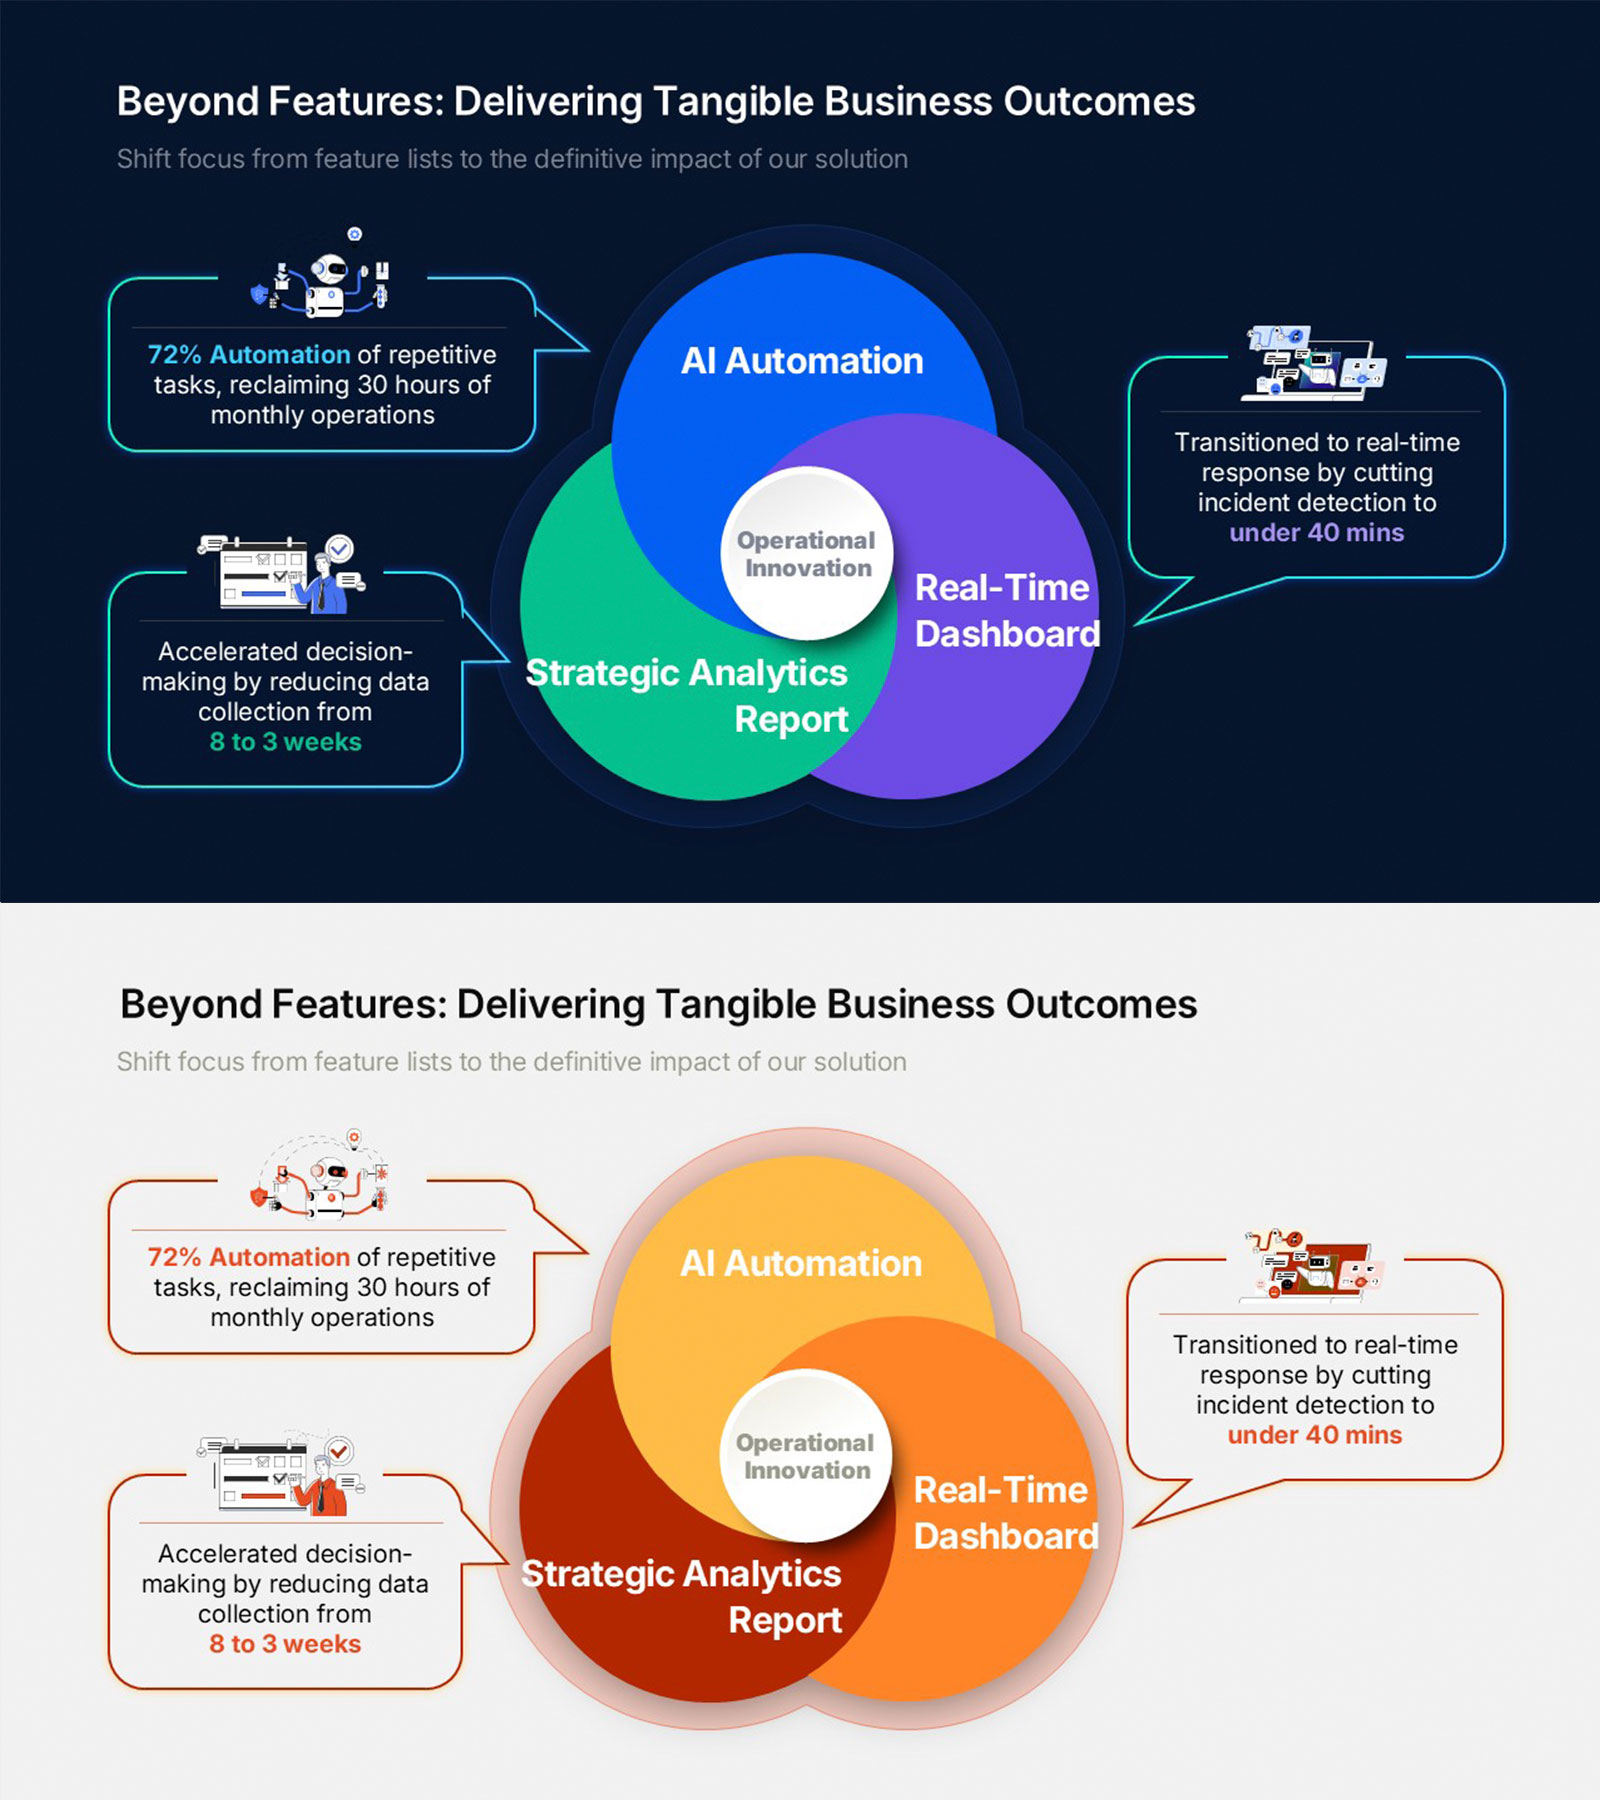
A single-slide PowerPoint template demonstrating tangible business outcomes from solution deployment across three pillars—AI Automation, Strategic Analytics Report, and Real-Time Dashboard—united in a three-circle Venn diagram with "Operational Innovation" at the center. Three metric callout blocks quantify the impact: "72% Automation of repetitive tasks, reclaiming 30 hours of monthly operations," "Accelerated decision-making by reducing data collection from 8 to 3 weeks," and "Transitioned to real-time response by cutting incident detection to under 40 minutes." Includes a dark navy version with blue, teal, and purple circles and a light white version with orange, yellow, and deep red tones. Editable in PowerPoint for IT and SaaS solution proposals, product presentations, and investor decks.
Usage Points
-
Main Usage
Use as the business impact section in IT solution proposals and SaaS product decks, presenting three operational pillars and quantified outcomes on a single slide.
-
How to Use
Replace the three Venn circle labels and callout texts with your solution's performance metrics. Insert into the ROI or outcome section of any IT proposal or product presentation in PowerPoint.
-
Recommended For
Ideal for IT sales teams, SaaS solution consultants, and founders presenting quantifiable outcomes—automation rates, time savings, and response speed—to enterprise clients or investors.
-
Slide Structure
One slide. Center: 3-circle Venn hub (AI Automation, Strategic Analytics Report, Real-Time Dashboard; center: Operational Innovation). Left: 2 metric callout blocks. Right: 1 metric callout block. Dark navy and light white versions included.
Related Products
-

Social & Economic Impact Metrics Infographic Slide
#Company Introduction #Business Strategy #Diagram
-

Startup Traction Slide Highlighting Growth Metrics and Achievements
#Company Introduction #Business Strategy #Key Achievements
-

Blue Orange Vertical Bar Chart – Emphasizing Creativity
#Company Introduction #Business Strategy #Graph
-

Curved Theme Purple Bar Chart – Effective Performance Analysis
#Company Introduction #Business Strategy #Graph
