Chart Analysis of External Activities – Performance and Strategy
RJ0600011_21
- Last Update 06/23/2025
- File Size 1.4MB
- # of Slides 2
- File Format PPTX
- Slide Ratio 16:9
- Color
Keywords
- #Content-Based Slides
- #Design-Based Slides
- #Company Introduction
- #Business Strategy
- #Diagram
- #Other
- #Key Achievements
- #Achievements
- #Table
- #Mockup
- #16:9
- #chart analysis PPT slide
- #performance analysis PowerPoint
- #external activity analysis slide
- #business performance chart PPT
- #comparative data visualization slide
About the Product
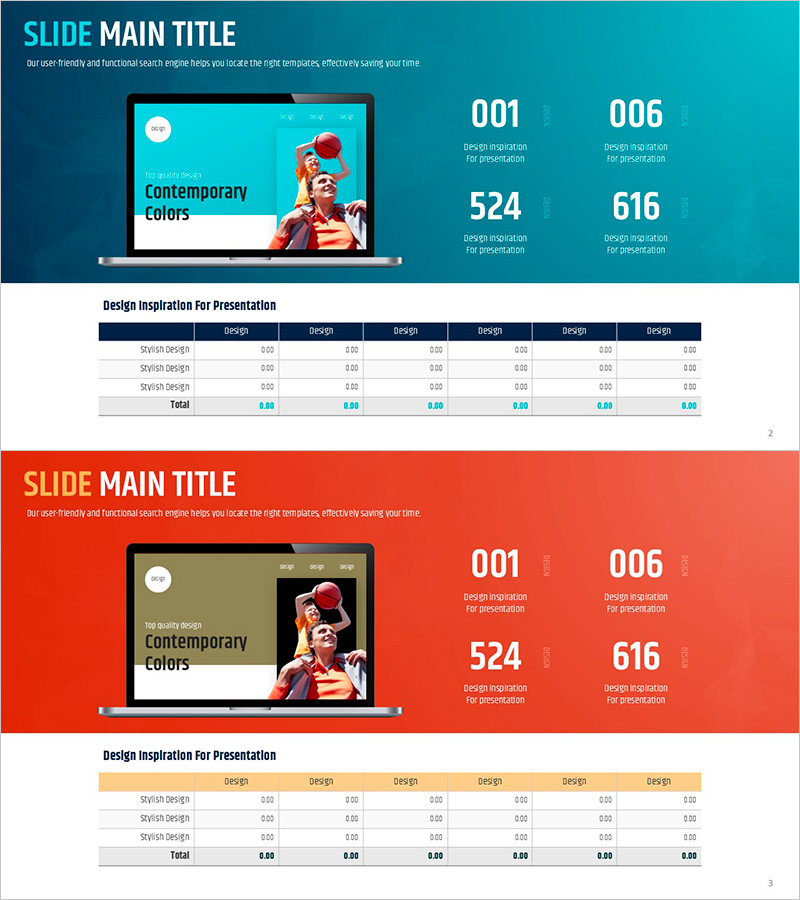
A PowerPoint slide designed to visually analyze the performance and strategy of external activities using a dual-color contrast layout in turquoise and coral. The slide features a laptop mockup image with four key performance indicators (001, 006, 524, 616) prominently displayed at the top, allowing viewers to grasp performance metrics at a glance. The bottom section includes a data table for detailed information input. This slide is ideal for business performance reports, quarterly reviews, external activity evaluations, and strategic presentations.
Usage Points
-
Main Usage
This slide visualizes external activity performance metrics and strategy through data-driven analysis. The four numerical indicator areas at the top combined with the table section below enable simultaneous presentation of quantitative results and qualitative analysis, with turquoise and coral background contrast emphasizing key content.
-
How to Use
Use in quarterly business performance reports, external activity evaluation meetings, and strategic planning presentations. Input KPI metrics in the top numerical areas and enter detailed data (design, development, operations, etc.) in the bottom table to compare and analyze performance trends.
-
Recommended For
Ideal for business managers, strategic planning teams, and executives preparing performance reports. Particularly useful for organizations requiring quarterly or annual performance evaluations, business progress updates, and external activity impact analysis.
-
Slide Structure
Two-slide layout with Slide 1 featuring a turquoise background and Slide 2 with a coral background, both containing identical layouts. Each slide includes a title area at the top, four performance indicators in the center (001, 006, 524, 616), and a seven-column data table at the bottom (design, development, and five other categories).
Related Products
-

KPI Target vs Actual Slide – 4-Metric Dark Red & Purple
#Company Introduction #Business Strategy #Financial Plans and Performance
-

Blue Orange Vertical Bar Chart – Emphasizing Creativity
#Company Introduction #Business Strategy #Graph
-

Graph Slide Visualizing Performance and Future Prospects in Pink and Bluegreen
#Company Introduction #Business Strategy #Graph
-

Achievement Rate Donut Chart – A Visual Tool for Business Performance
#Company Introduction #Business Strategy #Graph
