Long-Term Revenue Growth Simulation for SaaS Business Models
RM0500012_6
- Last Update 01/27/2026
- File Size 15.6MB
- # of Slides 2
- File Format PPTX
- Slide Ratio 16:9
- Color
Keywords
- #Content-Based Slides
- #Design-Based Slides
- #Financial Plans and Performance
- #Graph
- #Sales and Revenue
- #Column
- #Column Chart
- #16:9
- #SaaS revenue simulation PowerPoint
- #revenue growth chart slide
- #bar chart template
- #business model analysis presentation
- #financial strategy deck
- #investor pitch deck template
About the Product
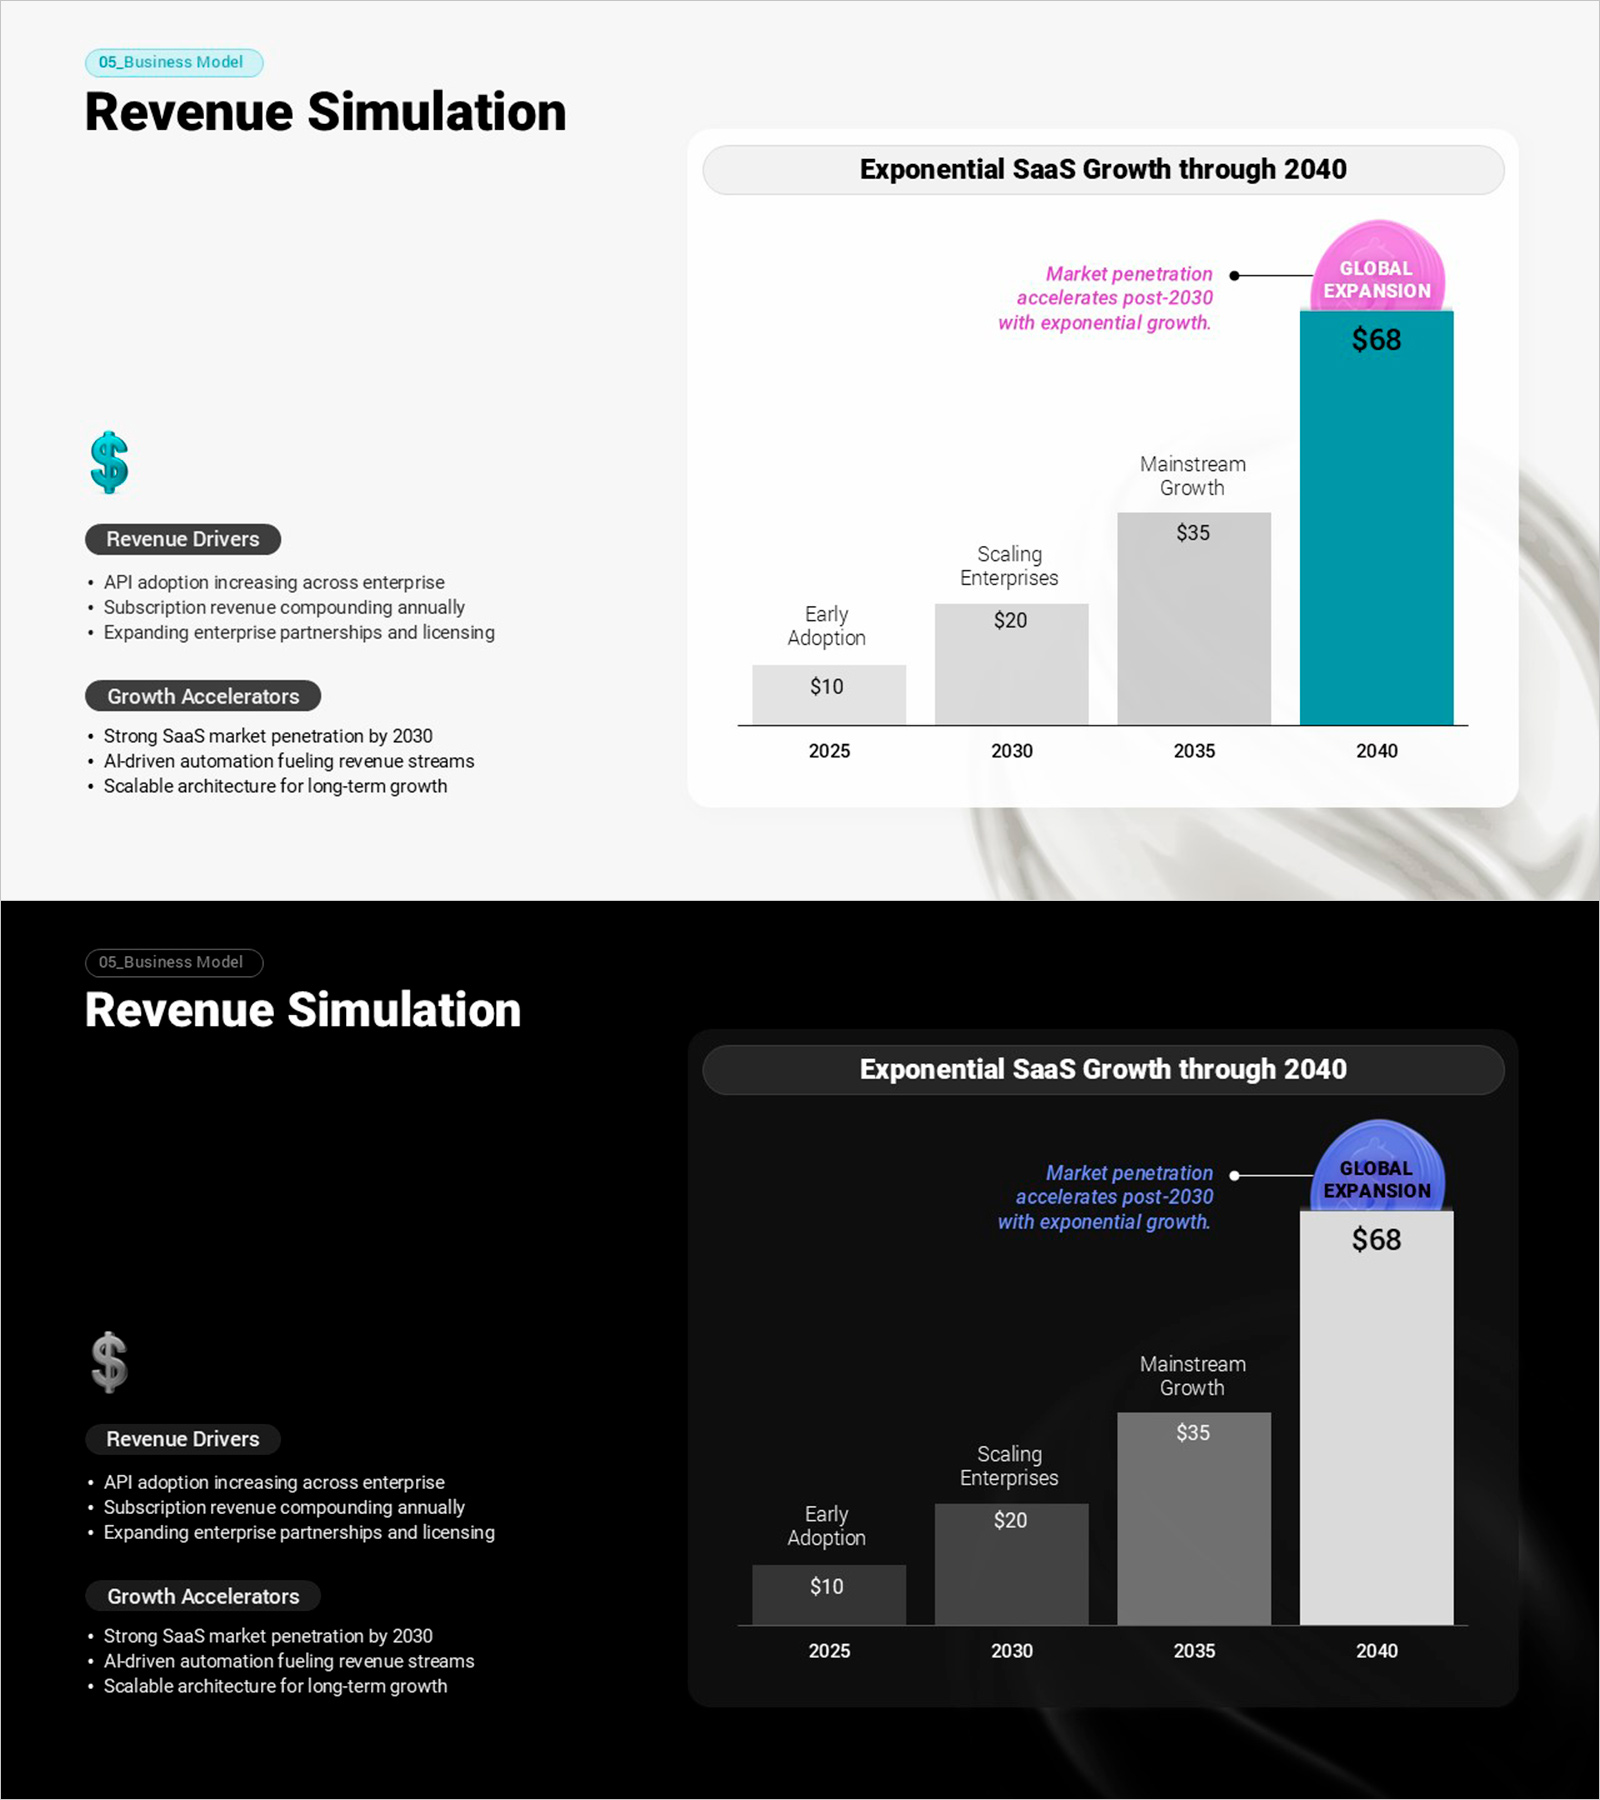
A PowerPoint slide that visualizes long-term SaaS revenue growth across five distinct stages, from early adoption to global expansion. The vertical bar chart clearly displays revenue progression from $10 to $68, with each stage labeled by key business milestones: early adoption, scaling enterprises, mainstream growth, and global expansion. The design uses teal and gray color contrast to emphasize growth acceleration phases, with text annotations highlighting market penetration drivers and revenue accelerators. This presentation slide is ready to use in investor pitch decks, business plan financial projections, and executive revenue forecasts.
Usage Points
-
Main Usage
Quantitatively simulates and visualizes long-term SaaS revenue growth trajectories. Breaks down the revenue progression from $10 to $68 across five distinct phases, allowing stakeholders to understand the characteristics and financial scale of each growth stage at a glance.
-
How to Use
Deploy in investor pitch meetings to demonstrate SaaS business model profitability, or in business plan financial projections to present mid-to-long-term revenue targets. Easily customize the revenue figures and stage labels to match your actual business data and growth assumptions.
-
Recommended For
SaaS founders, CFOs, investor relations managers, business development teams, and financial analysts. Particularly valuable for venture capital pitches, quarterly all-hands presentations, board meeting reports, and strategic planning sessions.
-
Slide Structure
Two-slide layout with identical bar chart structure on light and dark backgrounds. Five vertical bars represent stages (2025, 2030, 2035, 2040) with teal and gray coloring. Each bar is labeled with stage name and revenue figure, connected by arrows and text annotations explaining growth accelerators and market penetration factors.
Related Products
-

Business Plan Presentation Template - World Wide Map
#Market and Competitor Analysis #Financial Plans and Performance #Graph
-

Analysis of Factors Contributing to Excellent Sales Performance – Visualizing Success
#Business Strategy #Financial Plans and Performance #Graph
-

Typographic Wide Template Bar Chart & Table – Competitive Analysis and Performance
#Market and Competitor Analysis #Financial Plans and Performance #Diagram
-

Energy Battery Growth Graph Slide
#Financial Plans and Performance #Graph #Projected Return on Investment (ROI)
