Smart Living Statistics Slide – Donut Chart Infographic
RJ0700035_4
- Last Update 12/21/2025
- File Size 21.8MB
- # of Slides 2
- File Format PPTX
- Slide Ratio 16:9
- Color
Keywords
About the Product
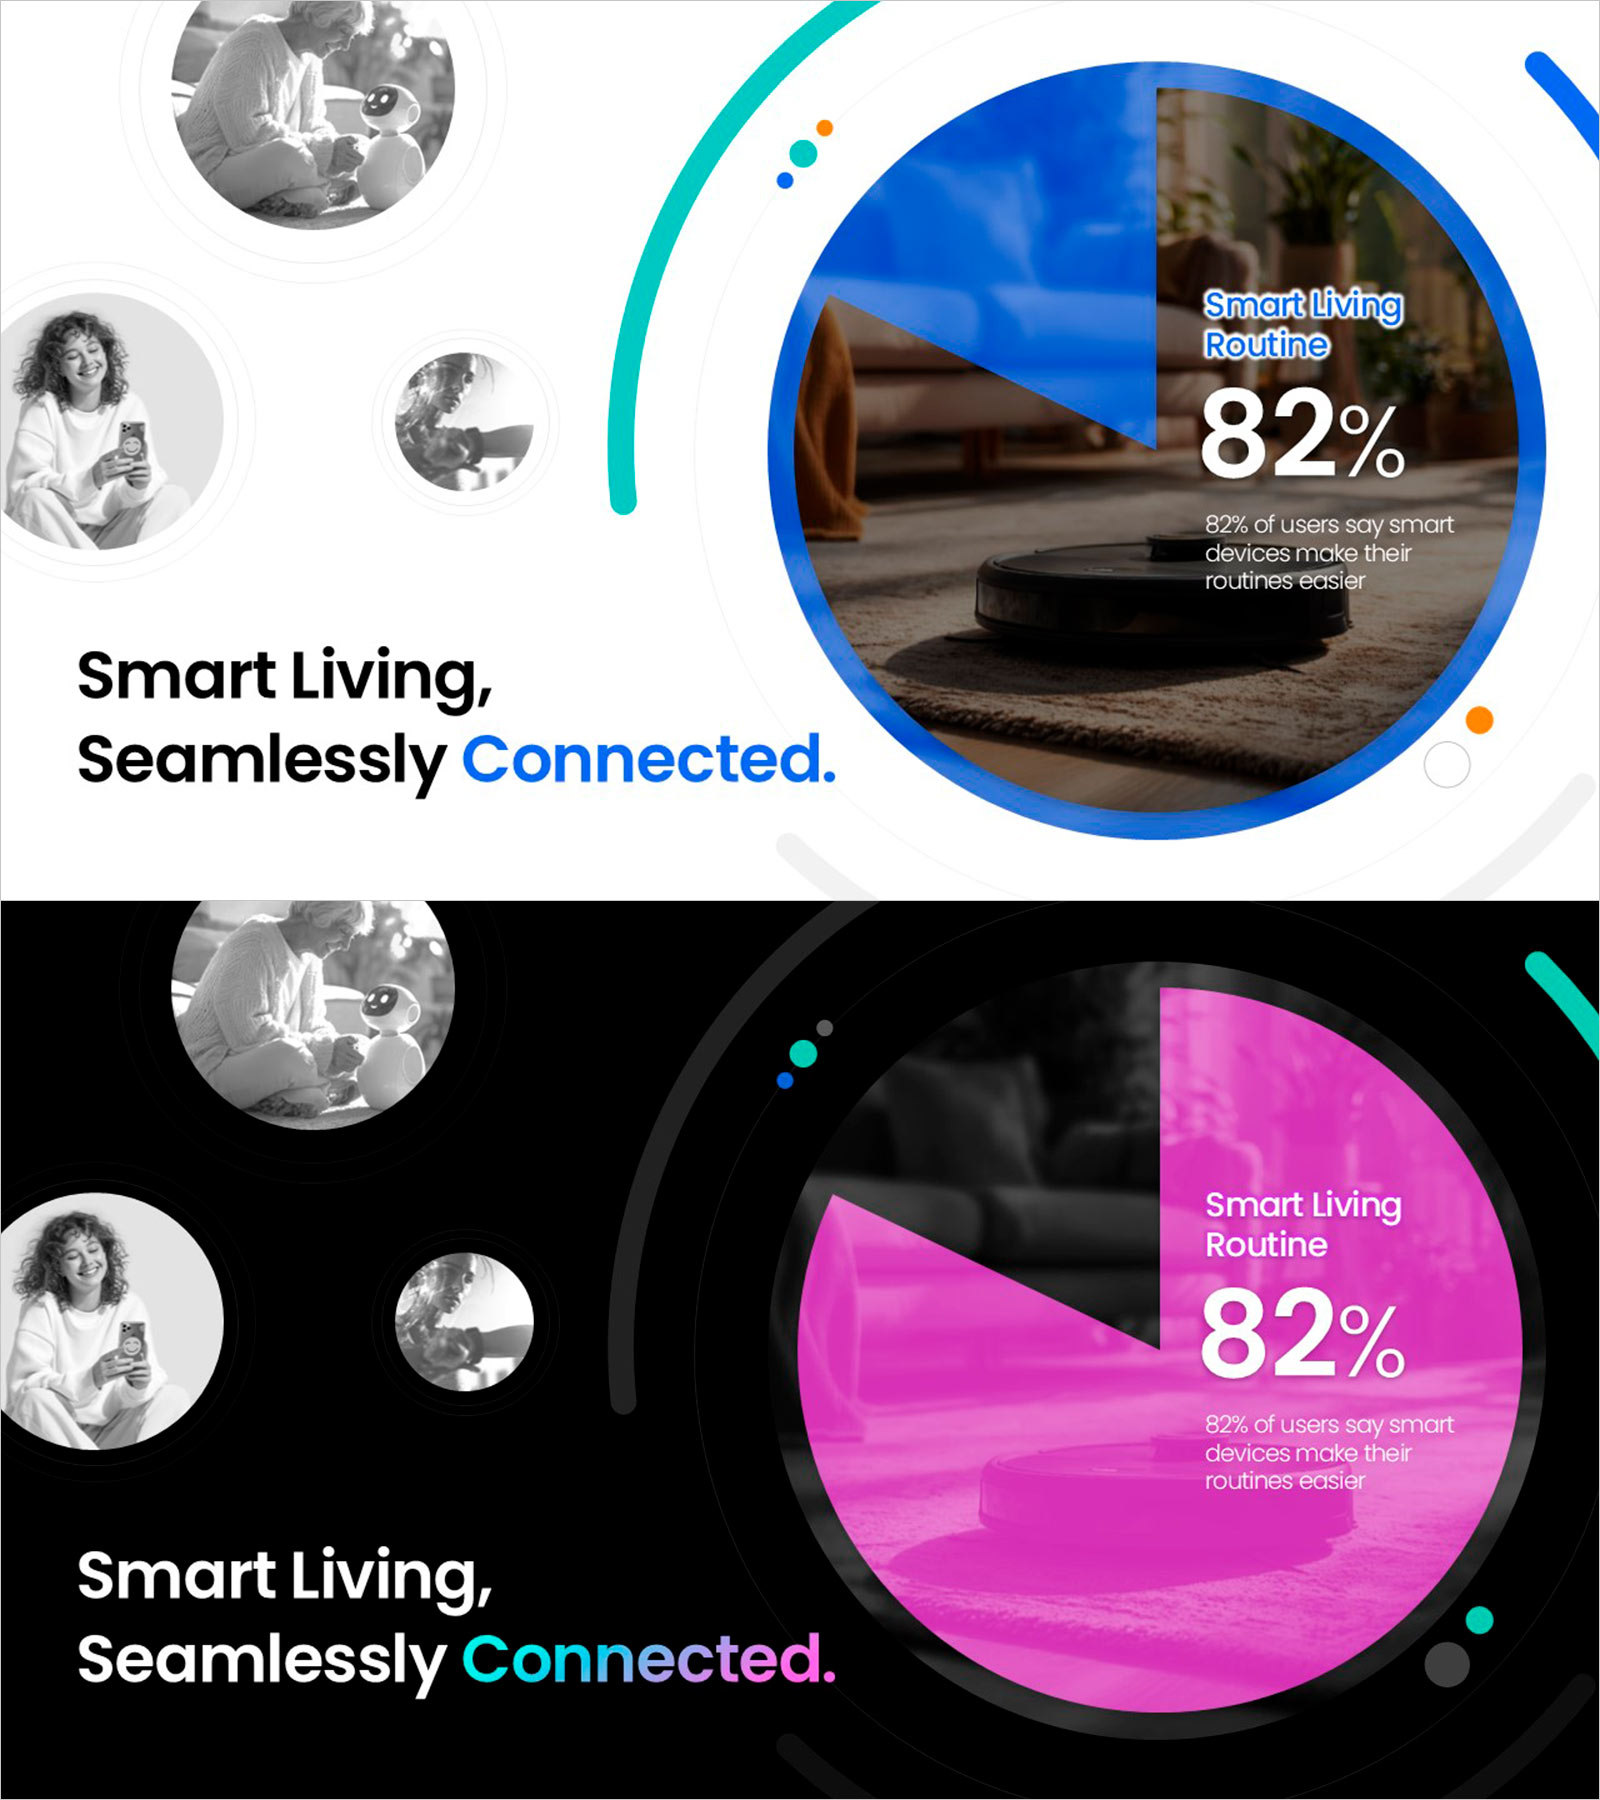
A pie chart PowerPoint slide emphasizing smart living statistics with an 82% user adoption metric. The design features a dual-tone background in blue and magenta, with a large circular chart highlighting the key percentage. Grayscale portrait photos contrast with the vibrant pie chart, creating strong visual impact for data presentation. This 2-slide PPTX template in 16:9 widescreen format is ready for immediate use in AI lifestyle, service performance, and user research presentations. Fully editable and compatible with all PowerPoint environments.
Usage Points
-
Main Usage
Designed to highlight single-metric data such as user adoption rates, service penetration, market share, or satisfaction scores using a prominent circular chart. The 82% statistic becomes the focal point, drawing audience attention to key performance indicators.
-
How to Use
Use the blue-background slide for baseline data introduction and the magenta-background slide for emphasis or alternative scenarios. Edit the pie chart percentage to match your actual statistics, and replace the left-side portrait images with relevant photos or team images for your presentation context.
-
Recommended For
Ideal for startup pitch decks, technology company performance reports, market research presentations, user satisfaction surveys, and IoT/smart home solution pitches. Recommended for marketing teams, data analytics departments, and executive briefings requiring clear statistical visualization.
-
Slide Structure
Two-slide layout with grayscale portrait photos (3 circular images) on the left, a large pie chart (82% emphasis) in the center, and text area in the upper right. Dual color variations (blue and magenta) enable layered data representation and visual hierarchy across slides.
Related Products
-

Human Analysis Chart – Visualizing Customer Analysis and Market Share
#Market and Competitor Analysis #Graph #Other
-

Development Status Analysis Circle Graph
#Product/Service Introduction #Market and Competitor Analysis #Graph
-

Brand Awareness Distribution Chart – Market Share Analysis
#Product/Service Introduction #Market and Competitor Analysis #Graph
-

Market Share Analysis Graph & Table – Enhancing Understanding through Data Visualization
#Product/Service Introduction #Market and Competitor Analysis #Diagram
