Development Status Pie Chart – Visualizing Market Share
RJ0300042_8
- Last Update 04/29/2025
- File Size 0.4MB
- # of Slides 2
- File Format PPTX
- Slide Ratio 16:9
- Color
Keywords
- #Content-Based Slides
- #Design-Based Slides
- #Product/Service Introduction
- #Market and Competitor Analysis
- #Graph
- #Development Status
- #Market Share
- #Circles
- #Pie Chart
- #16:9
- #pie chart PowerPoint
- #pie graph template
- #market share visualization slide
- #ratio data PowerPoint
- #how to create pie chart in PowerPoint
About the Product
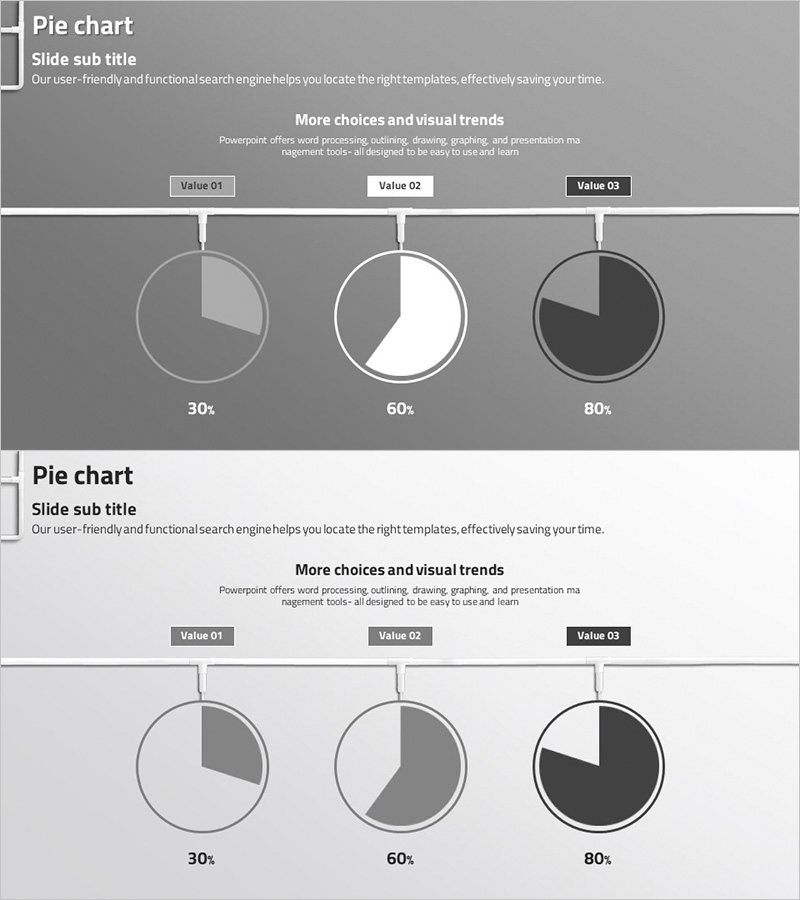
A PowerPoint slide template featuring pie charts for visualizing market share, sales distribution, customer composition, and other ratio-based data. The 2-slide set includes three circular pie charts displayed at 30%, 60%, and 80% proportions in gray, white, and dark gray tones. Each chart is labeled with Value 01, Value 02, and Value 03, with percentage figures clearly marked below. Provided in 16:9 widescreen PPTX format, the slides are fully editable—simply update the numbers and labels to match your data. Ideal for business presentations, quarterly reports, and strategic planning documents where proportion comparison is essential.
Usage Points
-
Main Usage
Clearly visualize market share, revenue distribution by product line, customer segment composition, budget allocation, and regional sales breakdown. Enables executives, investors, and stakeholders to grasp key proportions at a glance during board meetings, investor presentations, and strategic reviews.
-
How to Use
Replace the Value 01, Value 02, and Value 03 labels and percentage figures with your actual data. Adjust pie chart colors and segment sizes using PowerPoint's shape editing tools. Customize the title and subtitle areas to match your presentation context and messaging.
-
Recommended For
Finance teams presenting budget allocation and expense breakdown, sales teams analyzing regional or product-line revenue distribution, marketing teams segmenting customer demographics, executives delivering quarterly performance reports, and consulting firms presenting market analysis findings.
-
Slide Structure
2-slide set. Each slide contains a title and subtitle area, followed by three pie charts arranged horizontally at 30%, 60%, and 80% proportions. Value labels appear above each chart with percentage figures displayed below. One slide features a gray background, the other a white background, allowing flexibility to match your document's visual style.
Related Products
-

Modern Theme Pie Chart – Market Share Analysis
#Product/Service Introduction #Market and Competitor Analysis #Graph
-

Space Illustration Theme Circle Graph
#Product/Service Introduction #Market and Competitor Analysis #Graph
-

Pie Chart of the Development Status of the Snow Mountain Theme
#Product/Service Introduction #Market and Competitor Analysis #Diagram
-

Pie Chart for Learning Progress – Optimizing Data Visualization
#Product/Service Introduction #Market and Competitor Analysis #Graph
